
On this page
PHP-FPM monitoring helps you identify slow PHP requests, overloaded worker processes, growing request queues, and resource problems before they affect website performance. Instead of checking only whether PHP-FPM is running, you can monitor its status, review server resources, and find out why PHP applications are responding slowly.
PHP-FPM, short for PHP FastCGI Process Manager, manages PHP worker processes that execute application code. It is commonly used to run PHP applications such as WordPress and Laravel. With the right monitoring setup, you can identify performance bottlenecks, adjust worker settings, and keep your websites responsive under changing traffic.
What Is PHP FPM Monitoring?
PHP-FPM monitoring is the process of tracking the health, workload, and resource usage of PHP-FPM processes on a server.
PHP-FPM handles PHP requests by assigning them to available worker processes. When all workers are busy, incoming requests may have to wait. If this happens frequently, visitors may experience slow page loads, timeouts, or server errors even when the server itself is online.
Monitoring helps you understand what is happening behind the scenes. You can check active and idle workers, queued requests, slow requests, process limits, memory usage, and service availability.
For example, a WordPress website may load slowly because a plugin is running expensive database queries. PHP-FPM monitoring can reveal that requests are taking longer and that all available workers are busy. You can then investigate the application or database instead of blindly increasing server resources.
Why Should You Monitor PHP-FPM?
A running PHP-FPM service does not always mean your website is performing well. The service can remain active while its workers are overloaded or requests are waiting in a queue.
Regular monitoring helps you:
- Find performance bottlenecks: Identify busy workers, slow requests, and growing queues.
- Prevent worker exhaustion: Detect when PHP-FPM reaches its configured process limit.
- Manage server resources: Understand how PHP workloads use CPU and memory.
- Improve troubleshooting: Compare PHP-FPM metrics with web server, database, and application logs.
- Plan for traffic growth: Determine whether your existing worker configuration can handle typical and peak traffic.
- Reduce unnecessary resource changes: Identify the actual bottleneck before upgrading your server or changing PHP settings.
Monitoring is especially useful for hosting providers, developers, and administrators who manage multiple PHP websites on the same server.
Which PHP-FPM Metrics Should You Monitor?
The PHP-FPM status page provides several useful metrics. You can combine them with operating system monitoring and application performance tools to build a clearer picture of your server.
The following seven metric groups cover the main areas to watch.
1. Active and Idle Processes
Active processes are PHP-FPM workers currently handling requests. Idle processes are available to handle incoming work.
If active processes remain high while idle processes stay at zero during busy periods, your PHP workload may be using all available workers. This does not automatically mean the server is overloaded, but it is a reason to inspect the request queue and response times.
For example, a website with ten configured workers may have all ten processing requests during a traffic spike. If new requests continue arriving faster than workers can finish their jobs, visitors may experience delays.
Monitor active and idle processes together. A high number of active workers is not necessarily a problem when the server is handling traffic quickly.
2. Listen Queue and Queue Limits
The listen queue metric shows how many requests are waiting for an available PHP-FPM worker. The max listen queue metric records the highest queue length observed since the pool started, while listen queue len shows the configured queue capacity.
A queue that repeatedly grows above zero can indicate that incoming requests are arriving faster than PHP-FPM can process them. A queue that reaches its capacity may contribute to connection failures or timeouts, depending on the rest of the server configuration.
Check these values during periods of slow performance rather than relying on a single reading.
If the queue continues growing, investigate whether requests are taking too long, the worker limit is too low, or the application is creating unnecessary work. Simply increasing the queue capacity may delay failures without fixing the underlying bottleneck.
3. Maximum Active Processes and Worker Limits
PHP-FPM can use different process management modes, including static, dynamic, and ondemand. The selected mode affects how workers are created and managed.
The max active processes metric records the highest number of simultaneously active workers observed since the pool started. The max children reached metric indicates whether the pool has reached its configured worker limit.
If max children reached is greater than zero, PHP-FPM has reached that limit at least once since the pool started. It does not prove that the server is currently overloaded, but it is worth investigating alongside queue length, CPU usage, and response times.
The pm.max_children setting controls the maximum number of child processes for a pool in the relevant configurations.
Increasing this value without checking available memory can make performance worse. More workers allow more PHP requests to run concurrently, but each worker consumes resources. Choose a limit that fits the server’s available memory and workload.
4. Slow Requests
The slow requests metric counts requests that have exceeded the configured PHP-FPM slow request threshold.
A rising count may point to slow database queries, inefficient application code, external API delays, expensive plugins, or other tasks that take too long to finish.
You can configure a slow request threshold in the relevant PHP-FPM pool configuration. For example:
request_slowlog_timeout = 5s
slowlog = /var/log/php-fpm/www-slow.logThis example sets a five-second threshold and specifies a slow log path. The correct log directory and permissions depend on your system and PHP-FPM configuration.
When a request exceeds the threshold, PHP-FPM can write a backtrace to the configured slow log. That information can help identify where the request was spending its time.
Do not assume every slow request is caused by PHP itself. Check the application, database, and external services before deciding which part needs attention.
5. Request Duration and Throughput
Request duration measures how long a request takes to process. Throughput describes how many requests the application handles over a period of time.
The full PHP-FPM status output can show details such as the duration of the last request handled by each worker. However, this is not the same as a complete historical response-time chart.
For ongoing monitoring, use application performance monitoring tools, web server access logs, or metrics collected from your monitoring stack. Track average response time alongside percentiles such as p95, which represents the response time at or below which 95% of measured requests completed.
Throughput is useful when comparing performance before and after a change. If response times rise sharply while request volume remains similar, the application may have developed a bottleneck. If traffic increases significantly, you may need to assess whether the current worker configuration can handle the extra load.
6. CPU and Memory Usage
PHP-FPM workers consume CPU and memory while processing requests. High usage can result from expensive application code, heavy traffic, inefficient database interactions, or memory-intensive operations.
Use operating system tools to review resource consumption. For example:
top
free -h
ps aux | grep '[p]hp-fpm'The top command shows running processes and CPU activity. The free -h command displays memory usage, while the ps command helps you inspect PHP-FPM processes.
Pay attention to trends rather than one reading. A brief CPU spike during a traffic surge may be normal. Sustained high CPU usage combined with slow responses deserves further investigation.
Also remember that memory usage from multiple PHP workers adds up. When setting pm.max_children, leave enough memory for the operating system, database, web server, and other services running on the same machine.
7. Service Health and Process Restarts
Monitoring should also confirm that PHP-FPM is running and remains available.
A service can stop because of configuration errors, resource exhaustion, or other system problems. Frequent restarts may indicate an underlying issue even if the service appears healthy when you check it.
On a system using systemd, inspect the service with:
systemctl status php8.3-fpmThe service name depends on your Linux distribution, installed PHP version, and server setup. Replace php8.3-fpm with the correct service name.
To review recent service logs, use:
journalctl -u php8.3-fpm --since "1 hour ago"Look for failed starts, configuration errors, unexpected exits, and repeated restarts. Compare these events with application errors and server resource usage to find the cause.
How to Enable the PHP-FPM Status Page
PHP-FPM includes a status page that reports information about its process pool. You can enable it by setting pm.status_path in the relevant pool configuration.
The exact configuration file depends on your distribution and PHP installation. On many Linux systems, pool settings are stored in a file such as www.conf inside the PHP-FPM configuration directory.
Step 1: Find the PHP-FPM Pool Configuration
Locate the configuration file for the pool you want to monitor. It may be named www.conf, but custom pools can have different names.
If you are unsure where the file is located, check your PHP-FPM service configuration and installation directories.
Step 2: Configure the Status Path
Open the relevant pool configuration file and add or update the following setting:
pm.status_path = /fpm-statusThis defines the status URI. It does not automatically make the endpoint accessible through your web server; the web server and PHP-FPM pool must also be configured to handle requests to that path.
Step 3: Reload or Restart the Relevant Services
After validating the configuration, reload or restart PHP-FPM using the correct service name for your system. Depending on your web server setup, you may also need to adjust its configuration.
Avoid blindly restarting production services without understanding the impact on active requests.
Step 4: Check the Status Output
Once the endpoint is correctly configured, request it through the local or protected route you configured. For example, if your setup maps the endpoint to localhost:
curl http://127.0.0.1/fpm-statusThe exact URL and routing depend on your web server configuration. A failed request does not necessarily mean PHP-FPM is broken; the endpoint may not have been mapped correctly.
PHP-FPM can also return additional process information using the full query parameter. Depending on your PHP version, output formats can include JSON, HTML, XML, and OpenMetrics.
Important security note: Restrict the status page to local requests, trusted monitoring systems, or approved IP addresses. The output can expose request URLs and information about server resources. Do not leave the endpoint publicly accessible.
For configuration details, consult the official PHP-FPM status page documentation.
How to Monitor PHP-FPM From the Linux Command Line
You do not need a full monitoring dashboard to begin checking PHP-FPM. Linux commands can help you establish whether the service is running and whether processes are consuming excessive resources.
Check the Service Status
systemctl status php8.3-fpmThis shows whether the service is active and provides recent service information. Replace the example service name with the one installed on your server.
Review Recent Logs
journalctl -u php8.3-fpm --since "1 hour ago"Use the output to identify service failures, restarts, and configuration problems.
Inspect PHP-FPM Processes
ps aux | grep '[p]hp-fpm'This displays matching PHP-FPM processes. Review the process list to understand which workers are running and how they are using resources.
Monitor CPU and Memory
topFor a quick memory overview, run:
free -hThese commands provide a useful starting point, but they do not replace historical metrics or request-level monitoring. For a busy production website, collect data over time so you can compare normal operation with periods of poor performance.
Which PHP FPM Monitoring Tools Can You Use?
The best PHP-FPM monitoring tool depends on your server environment, the number of websites you manage, and how much detail you need.
| Tool or method | Best use | What to check |
|---|---|---|
| PHP-FPM status page | Direct PHP-FPM metrics | Active workers, idle workers, queues, slow requests |
| Linux command-line tools | Initial diagnosis | Service health, processes, CPU, and memory |
| Prometheus and Grafana | Metrics collection and dashboards | Trends, thresholds, and alerts from exported metrics |
| Netdata | Server-level visibility | Process activity and overall resource usage |
| Application performance monitoring (APM) | Application-level diagnosis | Slow transactions, request duration, and application bottlenecks |
Prometheus and Grafana are useful when you want historical dashboards and alerting. You will need an appropriate exporter or integration to collect PHP-FPM metrics. Netdata can provide server-level visibility, while an APM tool can help trace slow application requests.
These tools are not interchangeable. PHP-FPM’s built-in status page shows process-pool information, whereas application monitoring can provide more detail about the code and dependencies responsible for slow requests.
Start with the monitoring method that fits your setup. Add more tooling when you need historical comparisons, alerts, or deeper application tracing.
How to Troubleshoot PHP-FPM Performance Problems
Once monitoring identifies an issue, use the available evidence to find its cause instead of changing multiple settings at once.
| Symptom | Possible cause | What to investigate |
|---|---|---|
| Active workers remain high and idle workers stay at zero | Heavy traffic or slow requests | Request duration, slow logs, and worker limits |
| Listen queue repeatedly grows | Workers cannot process incoming requests quickly enough | Application performance, database queries, and process capacity |
max children reached increases | Pool reached its configured worker limit | Memory headroom, pm.max_children, and traffic patterns |
| PHP-FPM uses excessive memory | Many workers or memory-intensive requests | Per-process usage and application behavior |
| Slow request count rises | Slow application code or dependencies | Slow logs, database activity, and external API calls |
| Service repeatedly restarts | Configuration or resource problems | Service logs, PHP-FPM configuration, and system logs |
Check the Application Before Increasing Worker Limits
A high worker count does not always mean you need more workers. If every request is slow because the database is overloaded, allowing more PHP requests to run concurrently can put even more pressure on the database.
Check slow logs and application performance first. If workers are waiting on database queries or external services, fix those delays where possible.
Review PHP-FPM Process Manager Settings
PHP-FPM supports different process management modes. In dynamic mode, it manages the number of workers within configured limits. In ondemand mode, workers are created as needed. In static mode, the pool maintains a fixed number of workers.
The right mode and limits depend on the workload. Review settings such as pm.max_children, pm.start_servers, pm.min_spare_servers, and pm.max_spare_servers where applicable. Do not copy values from another server without checking available memory and traffic requirements.
Check Caching and Database Performance
Some PHP applications spend a large amount of time repeatedly generating the same output or querying the database. Appropriate application caching can reduce repeated work and help PHP-FPM workers finish requests sooner.
For WordPress workloads, review whether object caching is suitable for the application. CyberPanel users can explore the Redis object caching guide for a related approach to reducing repeated database work.
Caching is not a universal fix. Verify that the bottleneck is related to repeated application or database work before introducing another component.
Make One Change at a Time
After making a configuration or application change, monitor the same metrics again. Compare queue length, response times, CPU usage, memory usage, and slow request counts with the earlier baseline.
This makes it easier to determine whether the change helped. It also reduces the risk of making several changes that hide the original problem.
How Does PHP-FPM Monitoring Work With CyberPanel?
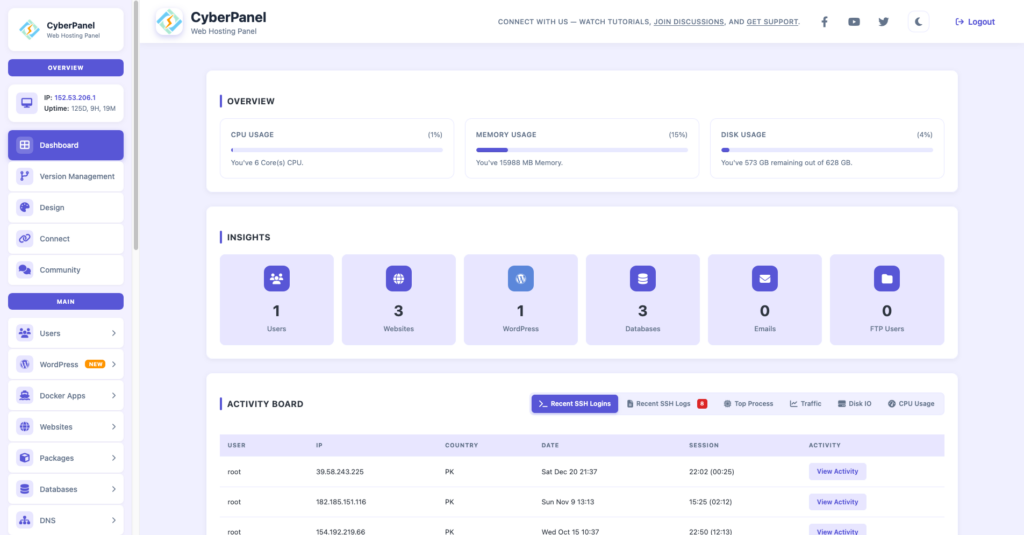
CyberPanel is a free and open-source web hosting control panel powered by OpenLiteSpeed. When you manage PHP websites on a CyberPanel server, PHP-FPM monitoring can help you investigate slow application requests alongside broader server and website performance issues.
The precise PHP execution setup depends on your website configuration and installed stack. Do not assume that every CyberPanel website uses PHP-FPM in the same way. First, confirm which PHP handler your site uses and whether a PHP-FPM service is present.
If your site does use PHP-FPM, you can review the relevant service, pool configuration, status output, and system logs. Combine those checks with web server and application logs to determine whether a delay originates in PHP execution, the database, or another dependency.
For example, if a website responds slowly while the server has available CPU and memory, check whether PHP requests are waiting for workers or spending too long in application code. If the PHP workers are healthy but the database is struggling, changing PHP-FPM limits may not solve the problem.
The aim is to identify the actual bottleneck before changing the server configuration.
Frequently Asked Questions
What is the best way to monitor PHP-FPM?
Start with the built-in PHP-FPM status page and Linux service logs. These help you inspect worker activity, request queues, slow requests, and service health. Add a monitoring dashboard or APM tool when you need historical metrics, alerts, or request-level tracing.
How do I check whether PHP-FPM is running?
On a system using systemd, run systemctl status php8.3-fpm, replacing the example service name with the one installed on your server. You can also inspect recent logs to find startup failures and unexpected restarts.
Is the PHP-FPM status page safe to expose publicly?
No. The status page can reveal request URLs and information about available server resources. Restrict access to local requests, trusted monitoring systems, or approved IP addresses.
Conclusion
PHP-FPM monitoring helps you understand how PHP applications use worker processes and server resources. Start by tracking active and idle processes, listen queues, worker limits, slow requests, request duration, CPU and memory usage, and service health.
Use the built-in status page and Linux commands for initial checks. When you need historical trends or deeper application insights, add a suitable monitoring tool. Most importantly, investigate the cause of slow requests before increasing worker limits or server resources.
A consistent monitoring routine makes performance problems easier to diagnose and helps you keep PHP websites stable as their workloads change.