On this page
MariaDB performance tuning is not about changing dozens of database settings and hoping the server becomes faster. The better approach is to find the actual bottleneck, measure it, make one controlled change, and then measure the result again.
A slow MariaDB server can be caused by inefficient queries, missing indexes, insufficient memory, disk I/O, too many connections, or poorly chosen configuration values. This guide explains how to identify these problems and tune MariaDB without blindly copying configuration values from another server.
What Is MariaDB Performance Tuning?
MariaDB performance tuning is the process of improving database response times, resource usage, and overall throughput by optimizing queries, indexes, server settings, storage, memory, and workload behavior.
The important part is that there is no universal MariaDB configuration that works best for every server.
A database running on a 2 GB VPS with one WordPress website needs a very different configuration from a 64 GB server running hundreds of applications.
A good tuning process usually looks like this:
Measure → identify the bottleneck → make one change → test → measure again.
MariaDB’s own optimization documentation covers several areas that can affect performance, including buffers, caches, threads, indexes, queries, storage, and operating system resources.
Why Is MariaDB Running Slowly?
Before changing my.cnf, find out what is actually slowing the server down.
Common causes include:
| Symptom | Possible cause | What to investigate |
|---|---|---|
| High CPU usage | Expensive queries | Slow query log, EXPLAIN |
| High RAM usage | Memory configuration or workload | Buffer pool, connections |
| High disk I/O | Poor caching or heavy writes | InnoDB, storage, queries |
| Slow SELECT queries | Missing or ineffective indexes | EXPLAIN, indexes |
| Too many connections | Application or traffic pattern | Connection status |
| Long-running queries | Inefficient SQL or locking | Process list, slow log |
| Server becomes slow under load | Resource contention | CPU, RAM, I/O, connections |
Do not immediately increase innodb_buffer_pool_size just because a server feels slow.
If the problem is an inefficient query, giving MariaDB more memory may not solve it.
How to Check MariaDB Performance Before Tuning
Start by checking the MariaDB version:
mariadb --versionYou can also check it from SQL:
SELECT VERSION();The version matters because MariaDB configuration variables and behavior can change across releases.
Next, inspect the server status:
SHOW GLOBAL STATUS;You can narrow this down to specific metrics:
SHOW GLOBAL STATUS LIKE 'Threads%';SHOW GLOBAL STATUS LIKE 'Connections';SHOW GLOBAL STATUS LIKE 'Slow_queries';You should also inspect the currently running queries:
SHOW FULL PROCESSLIST;This can immediately reveal queries that have been running for an unusually long time.
For a broader view of the machine itself, use Linux tools:
topfree -hdf -hiostat -xz 1The goal is to determine whether the bottleneck is actually MariaDB or whether MariaDB is simply being affected by a CPU, memory, or storage problem.
For a broader server-level view, CyberPanel’s server performance monitoring guide covers metrics such as load average, disk usage, response time, and database performance.
Which MariaDB Performance Tuning Tools Should You Use?
You do not need a huge collection of monitoring software to start tuning MariaDB performance.
Several built-in tools and commands are already useful:
1. SHOW STATUS
Use:
SHOW GLOBAL STATUS;This provides counters that can help you understand connections, queries, threads, temporary tables, and other server activity.
2. SHOW VARIABLES
Check the current configuration:
SHOW GLOBAL VARIABLES;For a specific variable:
SHOW GLOBAL VARIABLES LIKE 'innodb_buffer_pool_size';3. SHOW PROCESSLIST
Use:
SHOW FULL PROCESSLIST;This helps identify running queries, sleeping connections, locked operations, and long-running processes.
4. EXPLAIN
When a query is slow, EXPLAIN can show how MariaDB plans to execute it:
EXPLAIN SELECT * FROM users WHERE email = '[email protected]';You can use this information to investigate table scans, indexes, joins, and estimated rows.
5. Slow Query Log
MariaDB’s slow query log records queries that take longer than the configured threshold. It is one of the most useful tools for finding real workload problems instead of guessing.
6. Linux Monitoring Tools
Tools such as these help determine whether the database is limited by the underlying server:
top
htop
free -h
vmstat
iostat7. Performance Schema
MariaDB Performance Schema can provide detailed information about SQL execution, waits, I/O, and other internal activity. It can be useful when basic status information does not explain the bottleneck.
How to Find Slow MariaDB Queries
One of the best ways to start performance tuning is to find queries that actually consume time.
Check whether slow query logging is enabled:
SHOW GLOBAL VARIABLES LIKE 'slow_query_log';You can also check the configured threshold:
SHOW GLOBAL VARIABLES LIKE 'long_query_time';On current MariaDB releases, some slow query logging variables have newer names, so check the variables available on your installed version before copying configuration from another server.
If the slow query log is disabled, you can enable it temporarily:
SET GLOBAL slow_query_log = 1;This change is not necessarily permanent. For persistent configuration, add the appropriate setting to your MariaDB option file and restart the service when appropriate.
The slow query log can reveal:
- Queries taking too long
- Queries examining too many rows
- Queries that do not use indexes
- Repeated expensive queries
- Queries causing unnecessary database load
Do not optimize every query that appears in the log.
Start with queries that are both slow and frequent or that consume significant resources.
How to Optimize MariaDB Queries With EXPLAIN
Suppose you have a query like:
SELECT *
FROM orders
WHERE customer_id = 1001
ORDER BY created_at DESC;Run:
EXPLAIN
SELECT *
FROM orders
WHERE customer_id = 1001
ORDER BY created_at DESC;Look at the execution plan.
A query that scans a huge table to return a small number of rows may indicate that the available indexes are not appropriate.
You might investigate an index such as:
CREATE INDEX idx_customer_created
ON orders(customer_id, created_at);But do not add indexes simply because they seem useful.
Indexes also consume storage and have a cost during INSERT, UPDATE, and DELETE operations.
MariaDB’s optimization documentation specifically covers index selection, composite indexes, index statistics, and cases where indexes cannot be used effectively.
CyberPanel also has a dedicated SQL query performance tuning guide, which can be useful when your bottleneck is query execution rather than MariaDB’s global configuration.
How to Tune the MariaDB InnoDB Buffer Pool
For servers using primarily InnoDB tables, innodb_buffer_pool_size is one of the most important settings to understand.
Check the current value:
SHOW GLOBAL VARIABLES LIKE 'innodb_buffer_pool_size';The buffer pool stores frequently accessed InnoDB data and indexes in memory.
A larger buffer pool can reduce disk reads, but that does not mean you should automatically assign almost all server RAM to MariaDB.
MariaDB documentation notes that the buffer pool can be configured up to around 80% of total memory in environments where the server is dedicated primarily to InnoDB workloads. That is a guideline for a particular workload, not a universal rule for every VPS.
For example, a CyberPanel server may also be running:
- OpenLiteSpeed
- PHP
- DNS
- Mail services
- WordPress
- Redis
- Backup processes
- Security services
Those services also need memory.
So instead of blindly using:
innodb_buffer_pool_size=80%look at actual memory usage first.
Check:
free -hThen inspect MariaDB’s current memory-related configuration:
SHOW VARIABLES LIKE '%buffer%';Make changes gradually and monitor the server afterward.
How to Tune MariaDB Connections
Too many database connections can consume significant resources.
Check the current maximum:
SHOW GLOBAL VARIABLES LIKE 'max_connections';Then check current and historical connection activity:
SHOW GLOBAL STATUS LIKE 'Threads_connected';SHOW GLOBAL STATUS LIKE 'Threads_running';You can also check:
SHOW GLOBAL STATUS LIKE 'Max_used_connections';Do not increase max_connections simply because an application occasionally reports connection errors.
First determine why connections are accumulating.
The application may be:
- Opening connections unnecessarily
- Failing to close connections
- Creating traffic spikes
- Running long queries
- Using an inefficient connection strategy
Increasing the limit without enough RAM can make an overloaded server worse.
How to Reduce MariaDB Disk I/O
Database performance is heavily affected by storage.
Check the server:
iostat -xz 1You can also inspect memory:
free -hIf MariaDB is constantly waiting on storage, investigate:
- Buffer pool sizing
- Query efficiency
- Index usage
- Temporary tables
- Large transactions
- Storage performance
- Background workloads
The goal is not simply to make MariaDB use more memory. The goal is to reduce unnecessary disk work.
This is particularly important on VPS hosting. CyberPanel notes that storage performance can become a significant bottleneck for servers running MariaDB alongside web, PHP, mail, and other services.
How to Tune Temporary Tables Carefully
MariaDB may use temporary tables when processing certain queries.
Check related variables:
SHOW GLOBAL VARIABLES LIKE 'tmp_table_size';SHOW GLOBAL VARIABLES LIKE 'max_heap_table_size';You can inspect temporary table activity:
SHOW GLOBAL STATUS LIKE 'Created_tmp%';If you see a large number of disk-based temporary tables, investigate the queries causing them.
Do not automatically increase temporary table memory.
Every connection can have memory requirements, and aggressive settings can create memory pressure when many connections are active.
First identify why temporary tables are being created and whether the underlying queries can be improved.
How to Use MariaDB Performance Tuning Tools for Query Analysis
A useful tuning workflow combines several tools instead of relying on one metric.
For example:
Step 1: Find the slow query
Use the slow query log.
Step 2: Run EXPLAIN
EXPLAIN SELECT ...;Step 3: Check indexes
SHOW INDEX FROM your_table;Step 4: Check server load
topStep 5: Check disk activity
iostat -xz 1Step 6: Measure again
After making a change, compare query execution time and system resource usage.
This approach is much safer than changing ten MariaDB variables at once because you can identify which change actually helped.
Can a MariaDB Performance Tuning Script Help?
A MariaDB performance tuning script can be useful for collecting information, but it should not blindly modify production settings.
A diagnostic script can collect:
#!/bin/bash

echo "=== MariaDB Version ==="
mariadb --version

echo
echo "=== Memory ==="
free -h

echo
echo "=== Disk Usage ==="
df -h

echo
echo "=== CPU Load ==="
uptime

echo
echo "=== MariaDB Status ==="
mariadb -e "SHOW GLOBAL STATUS LIKE 'Threads%';"

echo
echo "=== Connections ==="
mariadb -e "SHOW GLOBAL STATUS LIKE 'Max_used_connections';"

echo
echo "=== Slow Queries ==="
mariadb -e "SHOW GLOBAL STATUS LIKE 'Slow_queries';"

echo
echo "=== Buffer Pool ==="
mariadb -e "SHOW GLOBAL VARIABLES LIKE 'innodb_buffer_pool_size';"This type of script is safer because it collects information rather than making assumptions.
You can then use the output to decide what needs attention.
If you find a script online that automatically changes innodb_buffer_pool_size, max_connections, tmp_table_size, and other variables, do not run it blindly.
A setting that improves one server can hurt another.
How to Monitor MariaDB After Tuning
Performance tuning does not end when you change a configuration value.
Monitor the server after every meaningful change.
Check:
free -hiostat -xz 1And inside MariaDB:
SHOW GLOBAL STATUS LIKE 'Threads%';SHOW GLOBAL STATUS LIKE 'Slow_queries';SHOW GLOBAL STATUS LIKE 'Created_tmp%';For query-specific changes, compare execution time before and after the optimization.
You should also watch for unexpected side effects.
For example, increasing memory allocation might reduce disk I/O while causing the operating system to start swapping. That is not an improvement.
MariaDB Performance Tuning Checklist
Use this checklist before declaring a database optimized:
| Area | What to check |
|---|---|
| Version | Is MariaDB supported and appropriately updated? |
| CPU | Are expensive queries consuming excessive CPU? |
| RAM | Is MariaDB competing with other services for memory? |
| Buffer pool | Is the InnoDB buffer pool appropriate for the workload? |
| Queries | Which queries are actually slow? |
| Indexes | Are important queries using suitable indexes? |
| Connections | Are connection counts reasonable? |
| Temporary tables | Are queries creating excessive disk-based temporary tables? |
| Storage | Is disk latency limiting database performance? |
| Monitoring | Are performance metrics being tracked after changes? |
Common MariaDB Performance Tuning Mistakes
Changing Everything at Once
If you change ten variables simultaneously, you cannot tell which change helped or hurt.
Change one logical area at a time.
Copying Someone Else’s my.cnf
A configuration from a 64 GB database server is not automatically suitable for a 4 GB VPS.
Always consider the workload and available resources.
Increasing max_connections Without Checking RAM
More connections can mean more resource consumption.
Find out why connections are high before increasing the limit.
Adding Indexes Everywhere
Indexes can speed up reads, but they also consume storage and add work to writes.
Use query plans and workload data to decide which indexes are worthwhile.
Ignoring the Application
Sometimes the database is not the root cause.
A badly written application can repeatedly execute the same expensive query or request far more data than it needs.
Tuning Without a Baseline
If you do not record performance before making a change, you cannot reliably determine whether the change worked.
MariaDB Performance Tuning Best Practices
The safest approach is to keep tuning evidence-based.
Start with the slowest or most expensive workload.
Then:
- Record the current performance.
- Identify the bottleneck.
- Change one setting or query.
- Test the change.
- Monitor CPU, RAM, disk, and database metrics.
- Compare the result with the original baseline.
- Keep the change only if it improves the workload without creating another bottleneck.
For InnoDB-heavy installations, pay particular attention to memory and storage behavior. MariaDB provides dedicated documentation for InnoDB system variables, including the buffer pool and redo log settings.
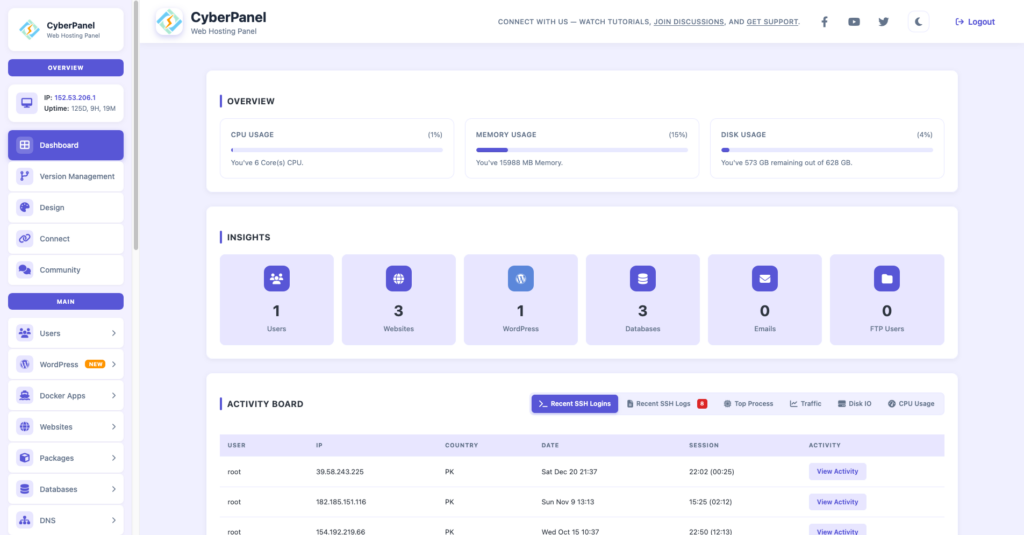
If your server hosts websites through CyberPanel, database tuning should also be considered alongside web server and application performance. CyberPanel’s MariaDB and MySQL management tools provide database management and MariaDB performance options through the dashboard.
Frequently Asked Questions
What is the best way to improve MariaDB performance?
Start by identifying the actual bottleneck. Check slow queries, execution plans, indexes, memory usage, connections, and disk I/O before changing global configuration values.
Which MariaDB setting should I tune first?
There is no single setting that should always be changed first. For InnoDB-heavy workloads, innodb_buffer_pool_size is important, but query performance, memory availability, and storage should be evaluated before changing it.
What are the best MariaDB performance tuning tools?
Useful tools include SHOW GLOBAL STATUS, SHOW GLOBAL VARIABLES, SHOW FULL PROCESSLIST, EXPLAIN, the slow query log, Performance Schema, and Linux tools such as top, free, vmstat, and iostat.
Final Thoughts
Effective MariaDB performance tuning starts with measurement, not configuration guessing.
Use the slow query log to find expensive SQL, EXPLAIN to understand query plans, indexes to improve data access, and Linux monitoring tools to identify CPU, memory, and storage bottlenecks.
Then make small, controlled changes and measure the result.
The best MariaDB configuration is not the one with the most aggressive settings. It is the one that matches the actual workload while keeping the entire server stable.
For production systems, tuning MariaDB performance should always be an iterative process: measure, change, test, and monitor.