

Picture this: On a Linux server, you are in charge of a vital e-commerce website.
Traffic is insane on this Black Friday. All of a sudden, orders stop processing, your server becomes sluggish, and consumers start leaving their carts behind.
Who’s at fault? Overloaded RAM and high CPU use. This scenario highlights why Linux Monitoring is so important! Configuring a server running Linux with a specific setup is simply not enough to manage servers efficiently over time.
You may prevent potentially disastrous situations if you are aware of what is happening with your servers.
This article brings you 9 amazing tips & tricks for Linux server monitoring to help you stay ahead of any performance issues.
Why Linux Server Monitoring Matters?

The main and basic purpose of Linux server monitoring is to optimize server performance by tracking resource usage and system load for overall business and IT operations. That’s why Linux monitoring matters!
Monitoring makes it simple to avoid downtimes. You can identify problems early, make the most use of your resources, and make sure your systems function at their peak by monitoring server health, performance, and security data. Now let’s get started with some useful advice for mastering Linux monitoring in 2024.
Real-world Example For You
Do you know that Netflix One of the biggest streaming services in the world, Netflix, depends on Linux servers to manage high volumes of traffic once back in 2013, they were able to prevent outages and maintain uninterrupted streaming by autonomously scaling their servers and tracking performance in real-time by using Linux monitoring tools like Prometheus, thanks to this proactive monitoring when they saw a spike in user demand, which raised the possibility of services outage.
Tip 1: Leverage Top Monitoring Tools for Linux Servers
The first step to Linux Server monitoring is to use the best tools. Fortunately, a wide range of Linux monitoring tools will be available in 2024. One can obtain information about system activity by utilizing the metrics provided by these technologies. To identify potential causes of a performance issue.
However, how can one judge if a solution is sound?
Well, for that take a look at the feature capability of the following Top 3 Linux Monitoring Tools we’ve picked to help you maintain your servers:
1. Datadog
This server monitoring tool for your servers lets you gather, correlate, and keep an eye on servers in addition to the data from the rest of your stack. With the help of their full-stack monitoring tool, you can integrate correlated metrics, traces, and logs into your server monitoring, enabling you to look into server problems at the host level, find hidden sources of latency, and visualize server metrics.
What makes Datadog a very flexible partner for server monitoring with more than 450 important integrations, such as AWS, Docker, or Azure.
2. Checkmk
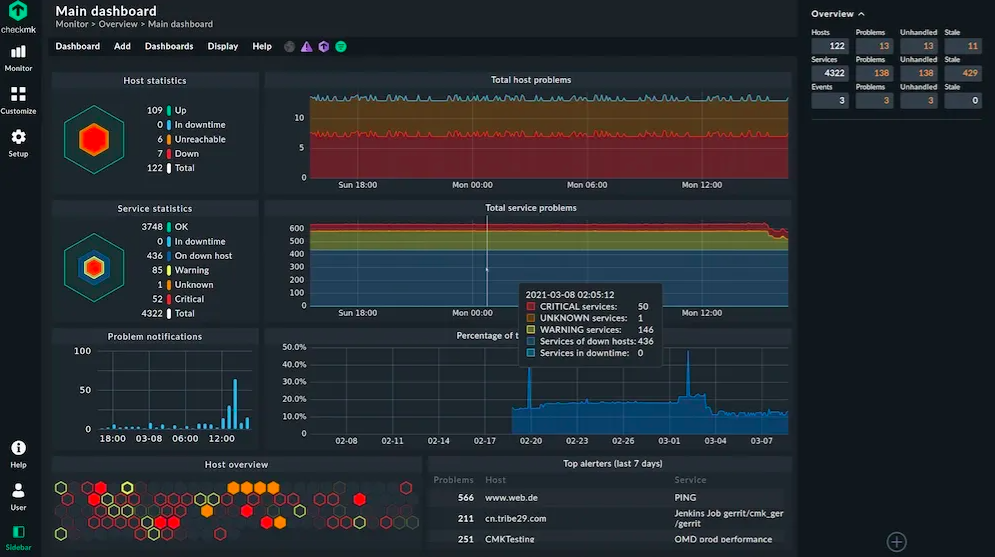
Checkmk is an open-source Linux server monitoring tool that, in a very short amount of time, provides an entire picture of your IT infrastructure.
Including your servers, Networks, Applications, Databases, Cloud, Containers, Storage, and IoT Checkmk offers over 1800 integrations for hardware, operating systems, cloud services, databases, and operating systems. Isn’t that amazing?

There is a 30-day trial available for their Enterprise Edition, however, the Raw Edition is free and open source.
3. Grafana on Prometheus
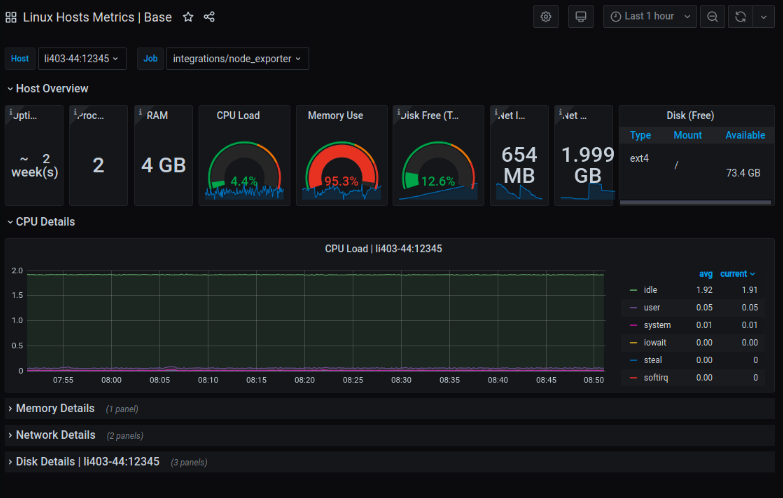
A toolset for Linux server monitoring and alerting that is built to be scalable and dependable. It has its own PromQL language and it gathers time series using a pull model over HTTP, a multi-dimensional data model, and strong alerting features. Prometheus is especially useful for keeping an eye on dynamic environments and cloud-native apps.
Also multiple modes of graphing and dashboarding support. In case of a failure, you can always check the statistics that are available regarding your system.
Tip 2: Monitor Key Performance Metrics Regularly
Finding out about a server outage through an angry email from a client is the worst-case scenario.
To keep track of your Linux performance monitor you must keep an eye on your KPIs ( Key Performance Indicators, to make it simpler for you to understand this further here are a few essential metrics:
I. CPU Usage
With an average utilization of 75% being safe for general servers, the CPU utilization KPI is an important measure that shows how much processing power is being used by it. For high-performance servers, up to 90% is appropriate.
In virtual settings, overuse can result in bottlenecks that need to be carefully managed. Aim for less than 50% for business-critical activities to guarantee that backup servers can manage failover without any problems. To identify CPU overload and task processing delays, check the load average (Linux) or processor queue length (Windows).
ii) Memory Usage
Memory usage is very important, particularly for database servers that have to have adequate memory to hold massive datasets. Performance is decreased by swapping, which uses disk space as virtual memory when memory is low.
For on-premise servers and virtual machines (VMs) without auto-scaling, aim for 80% memory use to provide a buffer against spikes. A larger barrier is acceptable for memory-intensive applications, but it needs to be closely watched.
Make sure failover servers can manage the demand on key systems by keeping memory consumption below 60%.
iii) Disk I/O and utilization
For all servers, disk input/output is necessary; this is especially true for applications that rely on read/write operations. Three important KPIs can be used to display the disk’s performance in the present and the future.
- Disk space available It goes without saying.
- Disk queue length The quantity of disk activity in the queue for processing.
- Disk IOPs an indication of the input-output processes that the disk is handling.
To avoid poor performance and sluggish reaction times, keep the disk queue length per disk spindle below 0.5. High disk IOPS can result in throttling and performance limitations, which can affect costs and performance, particularly in cloud-based systems.
iv) Network Traffic
You should keep a careful eye on your network throughput utilization KPIs, such as latency, jitter, and packet loss, if your business KPIs are affected by even slight network latency, as in the case of trading.
Try to maintain network utilization below 80% of available bandwidth for the best possible network performance. If you can do this consistently, you might think about switching to a stronger NIC with larger bandwidths and switches. To identify DDoS assaults and cryptocurrency mining, keep an eye on packet loss, jitter, and delay.
Set up alerts using Linux monitoring tools so you are notified whenever a metric crosses the predefined threshold.
Tip 3: Automate Monitoring with Shell Scripts
Automation is key if you want to monitor and manage multiple servers to streamline routine checks.
How you can do that is by creating Shell Scripts! What a Shell script actually does is it will monitor your CPU,
Don’t get scared, we’ll be guiding you through the whole process, it’s a few simple steps. We want to make sure by the end of reading the article, you’ll know how to make a Shell Script.
How Do I Install, Write, and Run a Shell Script?

Just follow these few simple steps:
- Open Your Terminal, to create a new Script
- Create a file and name it
monitor.shand open the file with the Vim editor:
mkdir monitor.sh && vi monitor.sh
The below script will run every five minutes and monitor the CPU and RAM usage of your Linux machine and will notify you if the usage.
#!/bin/bash

while true
do
    # Get current CPU usage as a percentage
    CPU=$(top -bn1 | grep "Cpu(s)" | awk '{print $2 + $4}')

    # Get current RAM usage as a percentage
    RAM=$(free | awk '/Mem/{printf("%.2f"), $3/$2*100}')

    # Check if either usage is above 80%
    if [ $(echo "$CPU > 80" | bc -l) -eq 1 ] || [ $(echo "$RAM > 80" | bc -l) -eq 1 ]
    then
        # Send an alert via email or any other desired method
        echo "CPU or RAM usage is above 80%! Take action immediately." | mail -s "Alert: High resource usage on EC2 instance" [email protected]
    fi

    # Sleep for 5 minute before checking again
    sleep 300
done
To make this script executable by running the following command:
chmod +x monitor.shAnother very effective tip for Linux monitoring is Log management and analysis is a way of looking into previous activities or events logs produced by computers to help businesses find vulnerabilities, tracking security concerns, troubleshooting, and other dangers early on.
Tip 4: Use Log Management and Analysis Tools
Now Log management uses tools that help it determine:
- How it should be logged in format.
- Which information and data must be logged.
- The duration of time that log data should be saved.
- When data is no longer needed, how should it be disposed of or destroyed?
Best Log Management Tools: Graylog and the ELK Stack (Elasticsearch, Logstash, Kibana).
Businesses should use these to actively monitor and analyze logs as well as detect disturbances, security lapses, and deterioration in performance.
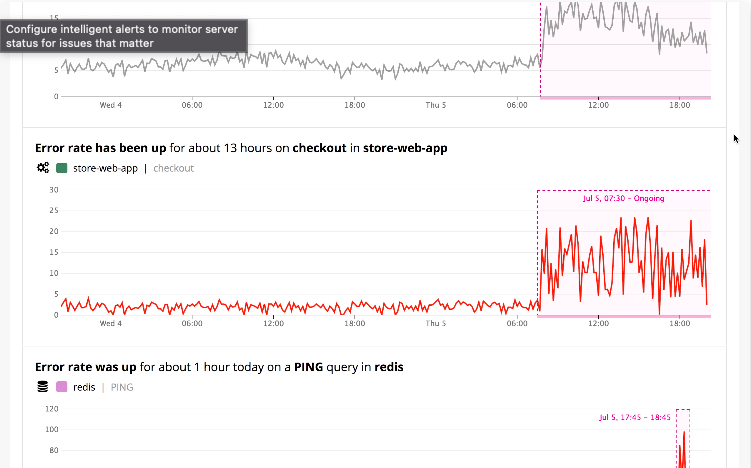
Tip 5: Set Up Real-Time Alerts and Notifications
To prevent server downtime and address issues beforehand, try setting up real-time alerts and notifications for Linux monitoring. You can set up alerts using your Linux monitoring tools according to key performance indicators (KPIs) such as CPU spikes, memory consumption, or disk space shortages.
The main purpose of Alerting is to draw human attention to the current situation rather than to continuously monitor systems. When a mistake occurs, a good alert repeats itself, notifying the appropriate parties on time. Ideal alerting is about escalation.
We recommend sending Alerts in the form of SMS, messaging platforms like Slack, or email. These notifications are proactive so they help reduce response times and maintain performance.
Tip 6: Using Cloud-Based Monitoring Tools
You can integrate cloud-based monitoring tools with Linux monitoring tools. Many famous cloud providers are offering built-in monitoring features that work with Linux servers very effectively. Using these systems, you can create alerts, monitor your infrastructure, and get performance statistics all from the cloud.
Some prominent cloud servers are:
- AWS
- CloudWatch
- Azure Monitor
Tip 7: Implement Security Monitoring and Auditing
Never ignore server security. There are about 20-30 major tools businesses are using for security monitoring and auditing.
Set up very secure SSH and passwords to secure your Linux servers. Make your passwords complicated so that even brute-force attackers won’t be able to easily crack them. Your passwords will be difficult for even the most skilled hackers to figure out, which can help keep them off your server.
Passwords are not required to securely access your Linux server thanks to SSH server keys. If you have trouble remembering passwords or would rather not use a password manager, they can be especially useful.
Or you can install a firewall, there’s a wide range of open-source firewall options for database protection available. However, some firewalls only allow specific people to access the server or only allow modest access. Easy Firewall, or UFW, is a dependable choice in most situations. If you want to establish a customized setup, UFW can be configured to only accept approved traffic.
Further, you can keep an eye on illegal access attempts and identify modifications to file integrity with the aid of programs like Tripwire and Fail2Ban. You can improve the security of your server against online attacks by combining these tools with your overall Linux monitoring plan.
Tip 8: Just Schedule Regular Health Checks and Maintenance
Regular health checkups and maintenance are part of the best Linux server monitoring strategies against complications. Make use of your tracking information to plan out tasks like checking your system performance, backups, security updates, and resource usage.
Use Cron a simple tool to automate regular health checks for maintenance.
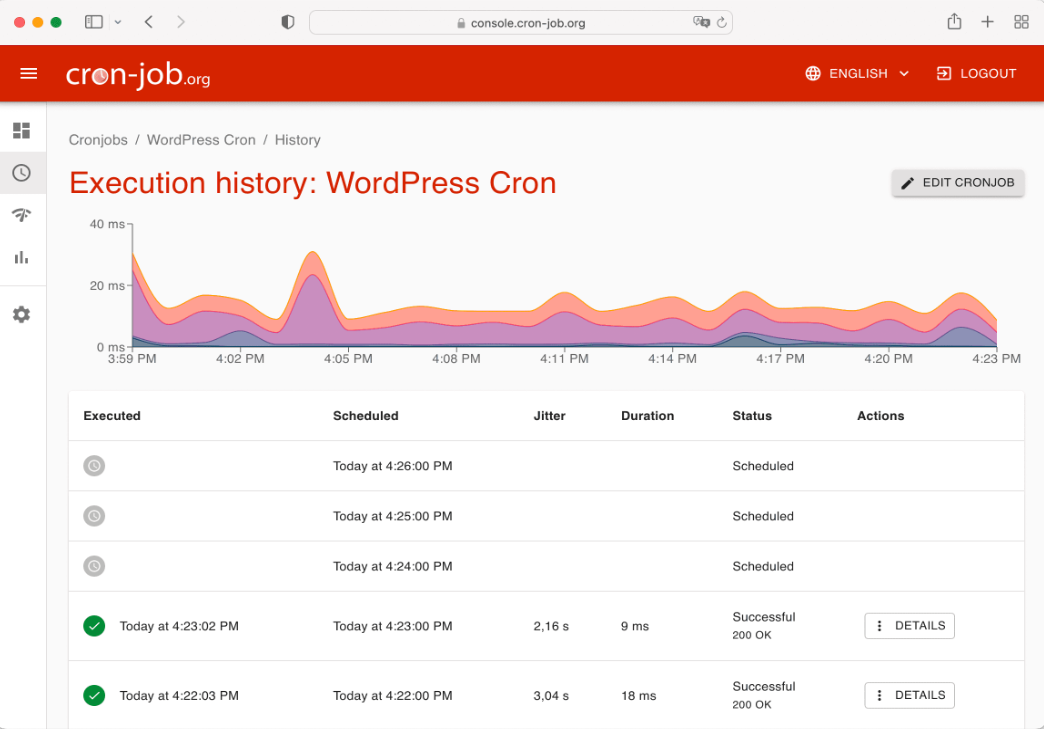
System administrators can use cron jobs to schedule routine maintenance, CPU,backups, and disk space monitoring. For systems that run nonstop, like virtual private servers, cron jobs are perfect given this. Web developers can also set them up to backup websites, check for broken links, and clean cache at different times by setting up parallel cron jobs.
Tip 9: Track Historical Data for Long-Term Insights
Even while long-term analysis provides insightful information about performance trends, short-term monitoring is still really important. To get historical statistics on resource utilization, system load, and network activities, use Linux monitoring tools. You can plan updates, predict future demands, and spot patterns using this information.
To ensure that your Linux infrastructure grows with your company’s needs and for long-term capacity planning, tracking historical data is quite helpful.
Final Thoughts: Stay Ahead with Proactive Linux Server Monitoring in 2024
The only way to keep an optimized high-performing IT infrastructure in 2024 is by leveraging the right Linux Server Monitoring tools like Datadog or Checkmk and implementing the 9 major tips and tricks we just talked about.
Automate regular health checks, proactively fix performance bottlenecks, manage resource utilization, with cron jobs or Ansible. In addition to reducing downtime, routine monitoring offers insightful information for long-term efficiency and scalability.
FAQ’s
1. What are the top Linux server monitoring tools for assessing server health?
Real-time information about server performance is available through tools like Datadog, checkmk, and Prometheus.
2. How often should I check the health of my Linux server?
Regular monitoring, often every 5 to 15 minutes, helps discover and fix issues before they influence performance.
3. How does Linux server performance get better with cloud-based Linux monitoring?
Real-time alerts, scalability, and remote server monitoring are all made possible by cloud-based monitoring.
4. Why is a Linux performance monitor for servers important?
By finding bottlenecks, spotting resource misuse, and improving performance, monitoring Linux servers helps avert possible problems. It guarantees uninterrupted, effective server operation.
5. What is the simplest method for keeping an eye on Linux disk usage?
The df and du commands can be used to track available space and usage patterns while keeping an eye on disk consumption.
