Running a pipeline without monitoring tools is like launching a rocket without knowing how it’s performing after liftoff.
Monitoring Tools in DevOps allow you to keep an eye on system health,errors, network, user experience and application performance all at once by gathering data from different sources and displaying it on a dashboard that highlights usage, availability, and performance metrics.
DevOps monitoring tools help DevOps teams spot problems early, minimize downtime, and make the best use of resources. In the fast-paced world of DevOps, real-time monitoring is essential, not just a luxury.
This guide covers the best monitoring tools in DevOps and how to choose the right one, you’re in the right place.
Why Monitoring is Essential in A DevOps Pipeline
DevOps monitoring tools focus on metrics associated with your software, team, and infrastructure. Aims to measure performance throughout all development phases. Tools for DevOps monitoring collect data from your network and applications, providing a real-time overview of your organization’s efficiency and security. This information can assist in IT planning.
Monitoring is crucial for assessing the performance of applications and IT systems. With sufficient data, it can evaluate the overall health of your organization. Additionally, monitoring enables developers to identify potential issues before they escalate. As your DevOps monitoring capabilities enhance, you can automate processes like debugging and workflow tracking.
Examine logs and data to determine the underlying causes of problems and enhance Mean Time To Detection, Isolation, Repair, and Recovery.
You get better cooperation between engineers, users, and the company, discover system behavior trends, find automation opportunities, respond to risks automatically or on-call, and establish a continuous feedback loop.
Type of DevOps Monitoring
- Application Performance Monitoring (APM): Monitors parameters such as resource usage, error rates, and response times. gives information on the health of the application and user experience.
- Infrastructure Monitoring: Monitors the performance, availability, and use of underlying infrastructure resources. assists in locating and fixing problems before they affect applications.
- Network Monitoring: Monitors metrics for microservices architectures and distributed applications, such as packet loss, throughput, and latency.
- Effective resource management and cost optimization are made possible by cost monitoring, which offers insight into cloud expenditure.
What To Consider When Choosing a DevOps Monitoring Tool
- Comprehensive observability: A solution that provides a unified view of various components.
- Intuitive interface: A tool featuring customizable dashboards and engaging functionalities.
- Automated asset discovery: Streamlines the identification of IT assets within a network.
- Real-time metrics, events, and distributed traces: Leverages monitoring data to spot errors before they escalate into significant issues.
- Root cause identification: Pinpoints and resolves the underlying causes of problems.
- Data retention policies: Tools come with defined limits for data retention to track system health trends.
- AI and Machine Learning integration: Some tools utilize AI to improve the resolution of technical issues.
- Monitoring resource usage and associated costs: Many cost-tracking tools are cumbersome and inaccurate, providing only total and average expenses.
Top Monitoring Tools in DevOps Everyone Loves!
1. Nagios
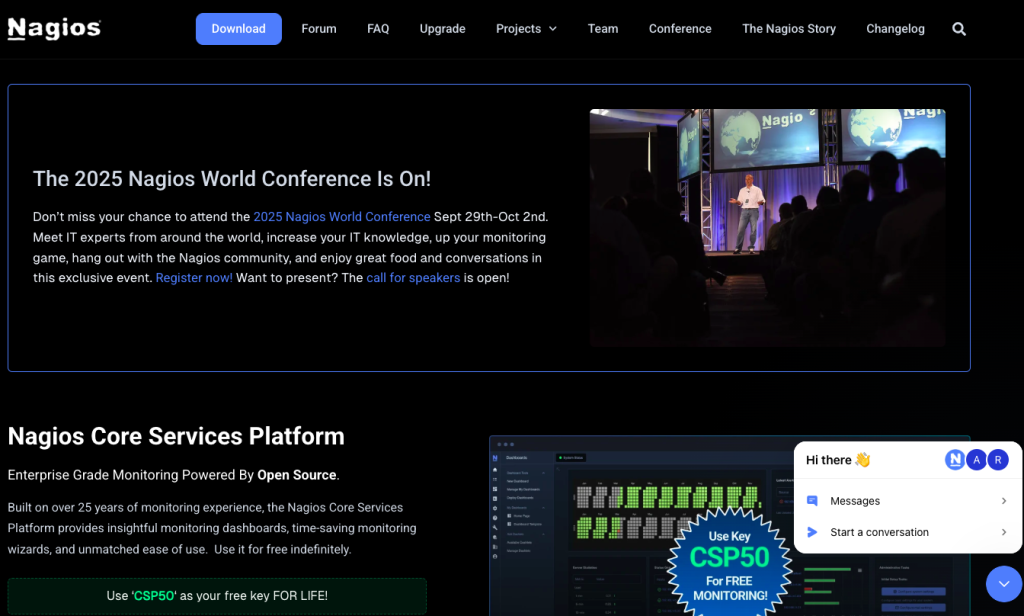
Nagios is an innovative monitoring tools in DevOps that provides monitoring for servers, applications, and networks. It can keep track of any device with an IP address and supports various server services such as POP, SMTP, IMAP, HTTP, and Proxy on both Linux and Windows platforms. Additionally, it allows for application monitoring, covering aspects like CPU usage, swap space, memory, and load analysis.
You can download Nagios for free, and it features an easy-to-use web interface. It also supports more than 5,000 integrations for server monitoring. The open-source version is known as Nagios Core, while the paid version, Nagios XI, offers monitoring for infrastructure, applications, networks, services, log files, SNMP, and operating systems.
2. Prometheus
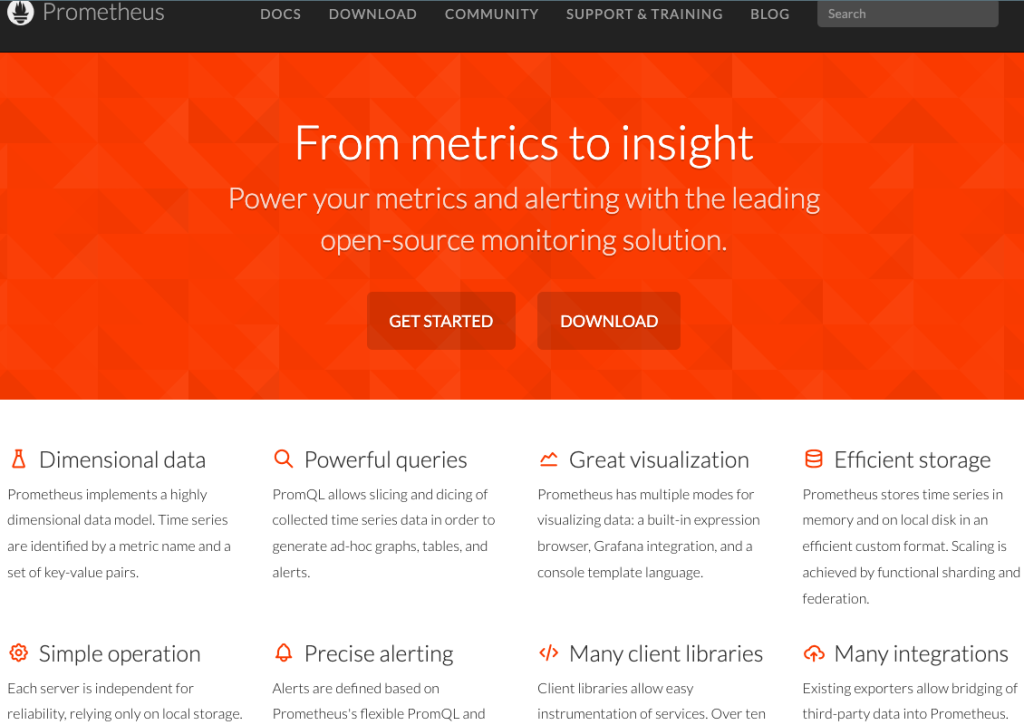
Prometheus is a community-supported, open-source monitoring system designed for DevOps teams. It can generate alerts and present your team’s data through customizable graphs. Numerous organizations utilize this tool for monitoring both infrastructure and applications. With the integration of Prometheus’ Alertmanager, it can also deliver tailored alerts to inform your team about system failures.
3. Datadog
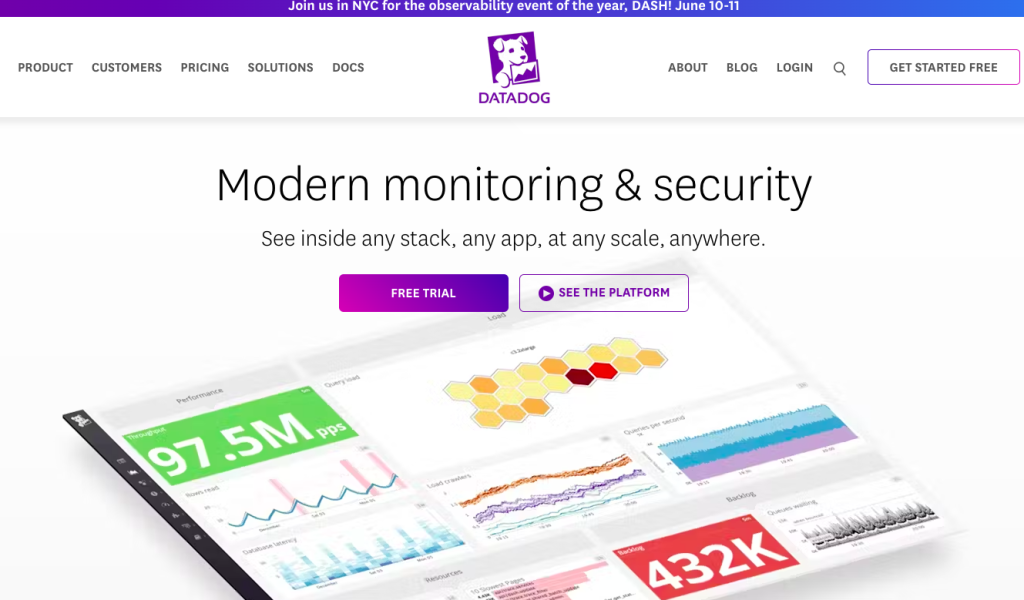
Datadog is a platform designed for monitoring and securing cloud applications, and gathering and analyzing various data such as metrics, traces, and logs. It offers comprehensive visibility across different environments, including hosts, containers, and serverless functions.
As an open-source infrastructure monitoring service, Datadog enables DevOps teams to oversee cloud environments and assess the health of their infrastructure. It includes monitors for important alerts and is user-friendly, though it may involve a complicated setup process and could be pricier compared to other options.
4. Zabbix
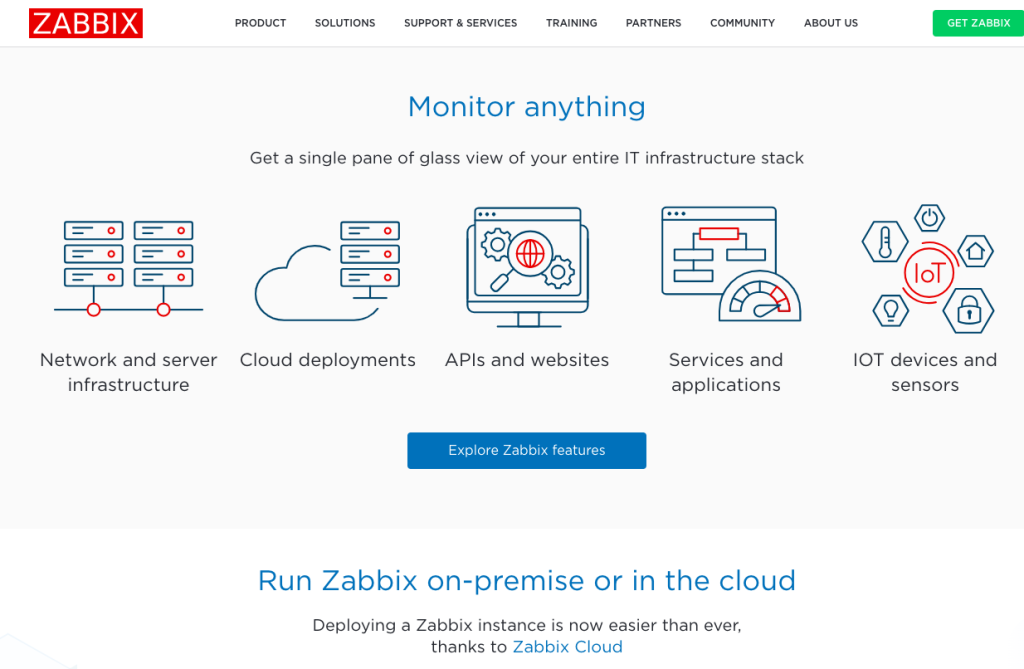
Zabbix is a leading alternative to Nagios, and one of the best monitoring tool for DevOps. It provides real-time monitoring for network traffic, services, applications, clouds, and servers. It can be deployed either on-premises or in the cloud.
The latest version, Zabbix 5.4, offers enhanced distributed monitoring, high availability, and support for various monitoring metrics, enabling you to expand your monitoring capabilities in a dynamic environment like DevOps.
As an open-source monitoring solution, Zabbix comes with built-in features such as SNMP, IPMI, and JMX. It provides comprehensive alerting and reporting options, along with a large community for support and learning. However, it may require significant resources and lacks advanced visualization options.

5. New Relic
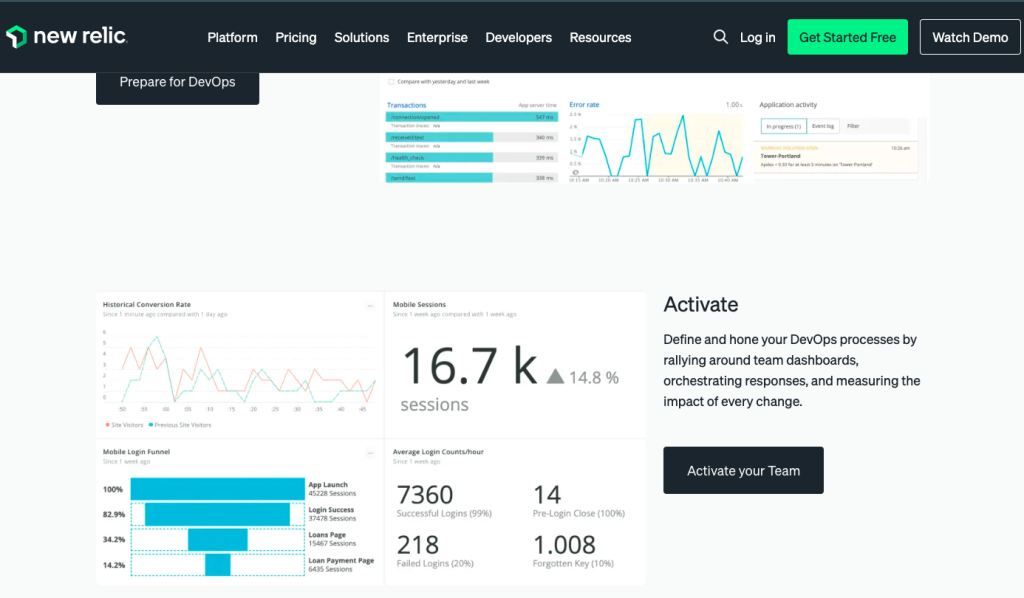
New Relic is a well-regarded monitoring tool in DevOps for several reasons. It provides strong error tracking, precise anomaly alerts, and sophisticated monitoring for containers (Kubernetes). Additionally, New Relic allows for real-time code debugging without the need for sampling.
In essence, New Relic serves as a comprehensive observability platform, covering everything from infrastructure and application performance monitoring (APM) to serverless and real user monitoring (RUM). It is also built on OpenTelemetry, ensuring compatibility with most tools and integrations in your current or future tech stack.
To use New Relic, you must install the New Relic agent on your servers or on each device you wish to monitor. However, it does not focus as much on security and compliance monitoring compared to other alternatives.
As a cloud-based monitoring solution, New Relic delivers full-stack observability, integrates with a variety of tools, and offers in-depth insights for troubleshooting. It supports applications built in Ruby, PHP, Java, .NET, and Python, but may face challenges when handling large volumes of data.
6. ELK Stack

Elastic Stack, also known as ELK, is a robust log analysis platform made up of three open-source tools: ElasticSearch, Logstash, and Kibana. It is highly effective for tasks such as monitoring, security, troubleshooting, compliance, SEO, and business intelligence. With a large and active community, it offers extensive resources, but its complexity can be challenging for newcomers. This platform enables developers to search, store, and analyze data from various sources efficiently.
Elastic Stack integrates three open-source tools into a single platform that is highly effective for log searching. It is built on ElasticSearch, Logstash, and Kibana. Which enable it to assist with monitoring, compliance, security, SEO, and troubleshooting. Developers leverage this extensive capability to search, store, and analyze data from various sources.
7. Splunk
Splunk is a comprehensive monitoring tool in DevOps that leverages analytics and is compatible with OpenTelemetry. It tracks machine-generated data throughout the entire lifecycle of an application. Splunk’s ongoing monitoring capabilities enable businesses to oversee the complete application lifecycle. It offers real-time monitoring of infrastructure, along with analytics and troubleshooting tools for on-premises, multi-cloud, and hybrid settings.
The platform includes integrated monitoring features, supports multiple technologies, and has a vast community for education and problem-solving. However, its dashboards are not very interactive, and its alerting system lacks depth.
Future Trends in DevOps Monitoring Tools
AI and ML for Automation in DevOps Workflows
- AI and ML are transforming DevOps by streamlining complex processes, boosting efficiency, and improving decision-making.
- AI tools can sift through large datasets from multiple sources, uncovering patterns, forecasting potential problems, and refining workflows.
- The global AI market is expected to expand from USD 214.6 billion in 2024 to USD 1,339.1 billion by 2030, with a compound annual growth rate (CAGR) of 35.7% during this period.
- Machine Learning (ML) algorithms enhance DevOps by analyzing past data, anticipating issues, optimizing resource allocation, and fine-tuning CI/CD pipelines for better efficiency.
- The incorporation of AI and ML into DevOps processes is a significant advancement for organizations, accelerating development and improving software delivery reliability.
Microservices Architecture and Serverless Computing
- Microservices and serverless computing are reshaping the development and deployment of modern applications.
- Microservices break down large, complex applications into smaller, self-sufficient components that can be scaled independently.
- Serverless computing handles infrastructure management, allowing developers to concentrate on coding and executing applications rather than managing servers.
- Serverless platforms automatically adjust application scaling based on demand, improving overall efficiency.
Advanced Monitoring and Observability
- Monitoring tools provide essential insights and notify teams when performance limits are exceeded.
- Observability gathers comprehensive data, including logs, traces, and metrics, to assess system performance.
- Monitoring your computer system is crucial for effective management, employing techniques like distributed tracing to enhance oversight.
Final thoughts
Monitoring tools in DevOps are very important. No matter if you’re deploying microservices, doing weekly updates, or managing a monolithic application, having clear visibility is crucial. Your choice of tool, whether it’s a powerful open-source option like Prometheus or a polished solution like Datadog, will depend on your specific needs, the scale of your operations, and your budget.
Choosing the right DevOps monitoring tools stack can reduce downtime and improve both user experience and team efficiency. Start with a free tool or explore a comprehensive solution, trust me your future self and your users will thank you for it.
FAQ’s
1. Is it possible to use several monitoring tools in DevOps at the same time? Yes, many teams combine Prometheus for metrics, Grafana for visualizations, and ELK for log management.
2. Which DevOps monitoring tools are most suitable for beginners? Grafana (for creating dashboards) and Zabbix (for comprehensive infrastructure monitoring) are both easy to use.
3. Are open-source tools sufficient for enterprise DevOps? They can be effective, especially with the right setup and support. However, commercial tools provide convenience and assistance for rapidly changing environments.
4. What is the importance of monitoring in CI/CD? It allows for early detection of deployment issues, facilitates rollbacks when necessary, and maintains the health of the pipeline.