

The article is a concise yet comprehensive resource designed to provide a clear understanding of MySQL slow query logs and how to interpret them effectively. This guide aims to unravel the complexities surrounding slow query logs, enabling users to identify and address performance bottlenecks and potential database issues.
Enabling the Slow Query Log for MySQL® proves to be a valuable asset in diagnosing performance and efficiency challenges that may impact your server. By pinpointing queries with notably sluggish execution times, you gain the ability to address them effectively by either restructuring the application responsible for the queries or optimizing the queries themselves. This proactive approach ensures that your queries are constructed with optimal efficiency, ultimately leading to improved overall system performance.
Introduction to MySQL
MySQL is one of the most popular open-source relational database management systems, widely used for storing, managing, and retrieving data for various web applications and software. As with any sophisticated database system, MySQL provides a robust logging mechanism to record essential information about its activities and performance. These logs play a crucial role in monitoring and troubleshooting the database’s behavior and can provide valuable insights into the system’s health and efficiency.
Types of Logs Generated by MySQL
There are several types of logs generated by MySQL, each serving a specific purpose:
- General Query Log: This log records every SQL query executed on the server, regardless of its source. It is a powerful tool for debugging and understanding the sequence of queries being executed, but it can also generate a vast amount of data, making it suitable mainly for short-term diagnostics.
- Error Log: The Error Log captures any errors encountered during the MySQL server’s operation. These errors can include issues with startup, shutdown, or other critical errors that may affect the database’s functionality. Monitoring the Error Log helps administrators quickly identify and address potential problems.
- Slow Query Log: As mentioned earlier, the Slow Query Log records queries that take longer than a predefined threshold to execute. This log is instrumental in identifying performance bottlenecks and inefficient queries, enabling administrators to optimize and enhance the database’s overall performance.
- Binary Log: The Binary Log contains a record of all data changes (inserts, updates, and deletes) made to the database. It is used for replication purposes, allowing data to be synchronized across multiple MySQL servers.
- Relay Log: The Relay Log is specific to MySQL replication. It stores data received from the master server before it is executed on the slave server in a replication setup.
How to Activate MySQL Slow Query Log?
Below are the steps to activate slow query log for MySQL or MariaDB.
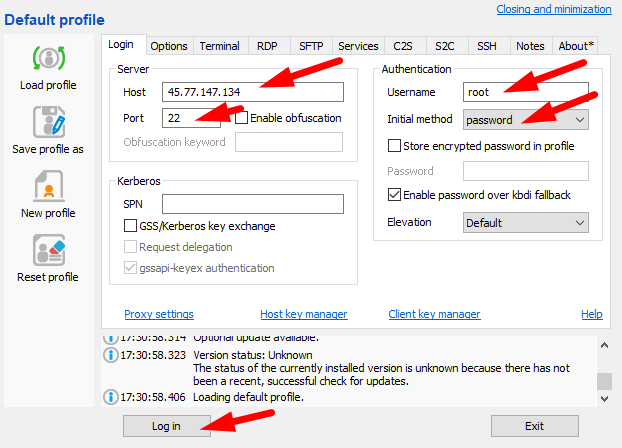
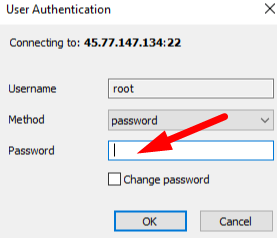
- First, you need to log in to SSH using Bitwise. Open Bitwise SSH Client. Provide your host, port, and username details, then choose the password from the Initial Method dropdown, and proceed by clicking on the login button. A pop-up will emerge, prompting you to input your SSH password. Enter the SSH password in the provided field.
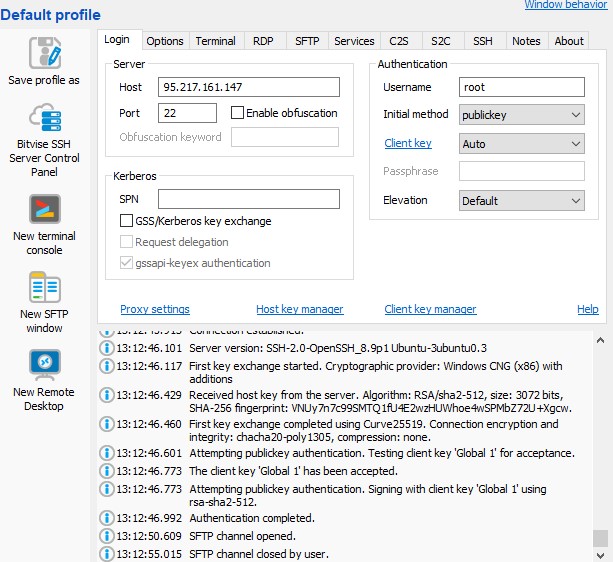
2. Access the /etc/mysql/my.cnf file using a text editor. For this first go to New SFTP Window from Bitwise SSH Client.
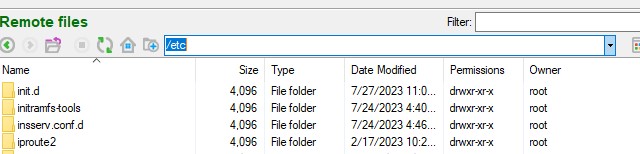
Now, type /etc in the search bar of the Remote files and press enter.
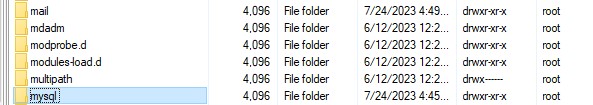
Open mysql or MariaDB file.
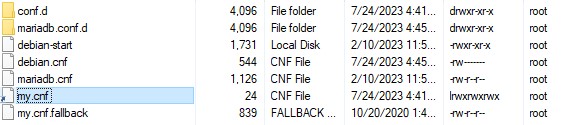
Now select my.cnf, right click and click edit.
A text editor will appear. Copy the following commands, paste them at the bottom of the file, and save it.
slow_query_log = 1
slow-query_log_file = /var/log/mysql-slow.log
long_query_time = 2
3. Now open the Bitwise terminal and run the following commands to generate the /var/log/mysql-slow.log file and assign the mysql user as its owner.
touch /var/log/mysql-slow.log
chown mysql:mysql /var/log/mysql-slow.log
4. To restart MySQL or MariaDB run the below command.
/usr/local/cpanel/scripts/restartsrv_mysqlRead MySQL Slow Query Log
Access the file containing the slow query logs using:
/var/log/mysql/mysql-slow.log
Inside the log file, each slow query is logged as an entry. These entries usually include details such as the timestamp, execution time of the query, the number of examined rows, and the actual SQL statement.
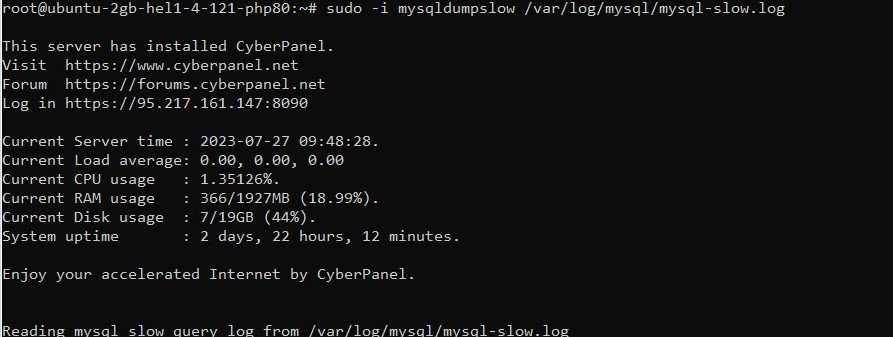
Instead of directly reading the slow query log, it is often more beneficial to utilize the “mysqldumpslow” command to parse and summarize the content of the log. You can execute the command while logged in as root through SSH, as follows:

sudo -i mysqldumpslow /var/log/mysql/mysql-slow.log
Below output will be obtained:
FAQs
What is the purpose of the mysqldumpslow command?
The mysqldumpslow command serves the purpose of parsing and summarizing the MySQL Slow Query Log’s content. It enables you to extract valuable information from the log file, including details about the most frequently occurring slow queries and their respective execution times. By executing mysqldumpslow /var/log/mysql/mysql-slow.log, you can effectively analyze and gain insights from the slow queries in an efficient manner.
Can I use the Slow Query Log for long-term monitoring?
Although the Slow Query Log proves valuable for short-term diagnostics, enabling it for extended periods can result in a substantial data volume being generated. To facilitate long-term monitoring, it is recommended to explore alternative approaches, such as employing monitoring tools and performance analysis solutions. Doing so helps prevent an overflow of the log with excessive entries and ensures effective management of database performance over time.
How can the Slow Query Log help in diagnosing database performance issues?
The Slow Query Log plays a vital role in diagnosing database performance problems as it identifies queries with slow execution times. Through analysis of these slow queries, administrators can precisely locate performance bottlenecks and inefficiencies in the database. Armed with this information, they can proceed to optimize queries, restructure applications, or implement essential changes to significantly enhance the overall system performance.
How can I optimize queries based on information from the Slow Query Log?
After identifying slow queries from the log, you have the opportunity to optimize them through various methods. This includes adding suitable indexes, rewriting queries, or restructuring the database schema. Moreover, employing query optimization techniques such as EXPLAIN and profiling can provide valuable insights and contribute to significant improvements in query performance.
Is the Slow Query Log applicable only for MySQL, or can it be used with other database systems?
The Slow Query Log is designed exclusively for MySQL and MariaDB database systems. While other database management systems may offer comparable features, it’s important to note that the log format and activation methods could vary between different systems.


3 Responses