
In the world of SEO (Search Engine Optimization), there is a multitude of tools and matrics available to help you optimize your website’s performance and enhance its visibility in search engine results. One such tool that plays a pivotal role in SEO is GT Matrics. In this comprehensive guide, we’ll delve into what GT Matrics is, how it works, and how you can use it to boost your website’s SEO performance.
What is GT Matrics?
GT Matrics, short for “Google PageSpeed Insights” (formerly known as Google PageSpeed), is a web performance analysis tool provided by Google. It offers insights into your website’s speed and performance on both desktop and mobile devices. Speed and performance are critical aspects of SEO, as they directly impact user experience and search engine rankings.
GT matrics generate a performance score and provide detailed insights into areas that need improvement.. Some of the key aspects it analyzes include:
- First Contentful Paint (FCP): FCP measures the time taken for the first piece of content to appear on a user’s screen. A faster FCP contributes to a better user experience.
- Largest Contentful Paint (LCP): LCP measures the loading time of the largest content element on a webpage, such as images or videos. It’s another crucial factor for user satisfaction.
- Cumulative Layout Shift (CLS): CLS gauges the visual stability of your site, ensuring that elements don’t shift unexpectedly during page loading.
- Time to Interactive (TTI): TTI measures how long it takes for your website to become fully interactive, allowing users to engage with your content.
- Total Blocking Time (TBT): TBT assesses the amount of time during which a user cannot interact with your page. Reducing TBT can improve user engagement.
- First Input Delay (FID): FID measures the time it takes for a user’s first interaction with your site to receive a response.
- Lighthouse Score: GT Matrics provides an overall score based on the Lighthouse audit tool, which takes into account various performance and best practices metrics.
Consider When Conducting a Website Speed Test
Conducting a website speed test is a crucial step in optimizing your website for performance, user experience, and search engine rankings. To ensure a comprehensive evaluation of your site’s speed, there are several key factors to consider:
- Choice of Testing Tool
Select a reputable and reliable website speed testing tool. Common choices include GT Matrics, Google PageSpeed Insights, Pingdom, WebPageTest, and PageSpeed Insights. Each tool may offer slightly different metrics and recommendations, so it’s a good practice to use multiple tools for a well-rounded assessment. - Test Frequency
Website speed can fluctuate due to various factors, such as changes in content or server load. Regularly conduct speed tests to monitor your site’s performance over time. - Geographical Locations
Test your website’s speed from various geographical locations. This helps you understand how well your site performs for users around the world. Different regions may have varying internet speeds and latency, so optimizing for a global audience is important. - Device Types
Test your site’s speed on both desktop and mobile devices. With Google’s mobile-first indexing, it’s essential to prioritize mobile performance. Ensure your site is responsive and loads quickly on smartphones and tablets. - Connection Speeds
Test your website on different connection speeds, such as 3G, 4G, and Wi-Fi. This simulates the experience of users with varying internet connectivity, helping you identify performance bottlenecks. - Content Caching
Disable or clear your browser’s cache when testing your site. This ensures that you’re evaluating the actual load time for new visitors who haven’t previously visited your site. - Repeat Tests
Conduct multiple tests to account for variations. Performance results can fluctuate due to server load, network conditions, and other external factors. Averaging the results of several tests provides a more accurate representation of your site’s speed. - Third-Party Resources
Assess the impact of third-party scripts and resources, such as analytics tools, ads, and social media widgets. These can significantly affect your website’s speed. Consider removing or optimizing them if they slow down your site. - CDN and Server Locations
If you’re using a Content Delivery Network (CDN), make sure to test your website’s speed from various CDN server locations. The proximity of the server to the user can affect load times. - Image and Media Optimization
Pay close attention to images and media files, as they often contribute to slow load times. Use proper image formats, compress images, and implement lazy loading to improve performance. - Content Delivery Strategy
Consider a Content Delivery Network (CDN) to distribute content efficiently. CDNs can cache and deliver content from servers located closer to users, reducing latency. - Security
Ensure that security measures, such as SSL certificates and server-side security configurations, don’t slow down your website. Strike a balance between security and performance.
How to Perform a Speed Test Using GT Matrics?
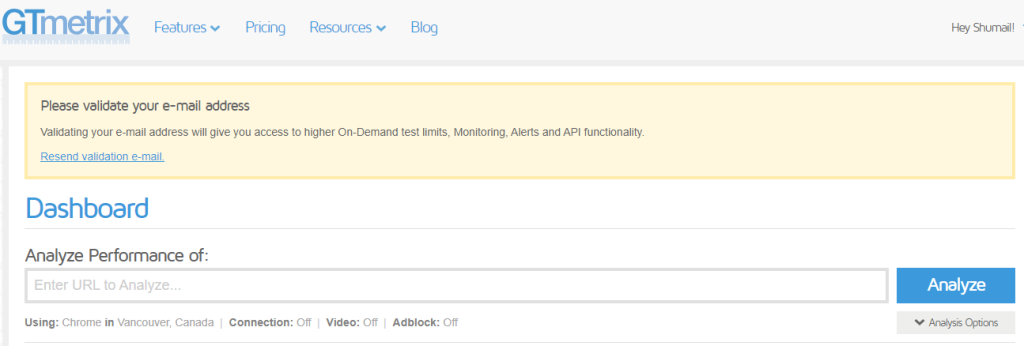
Using GT Matrics is a simple process. Simply enter the URL you wish to access, and you’re all set. However, if you want to customize the test configuration, take note of the Analysis Options button located just below the Analyze button. This Analysis Options button becomes accessible when you’re logged into your GT matrics account. Without signing in, you won’t have the ability to make adjustments to the region or other testing options.
Here we have tested our server for Vancouver, Canada. This location can be changed as well.
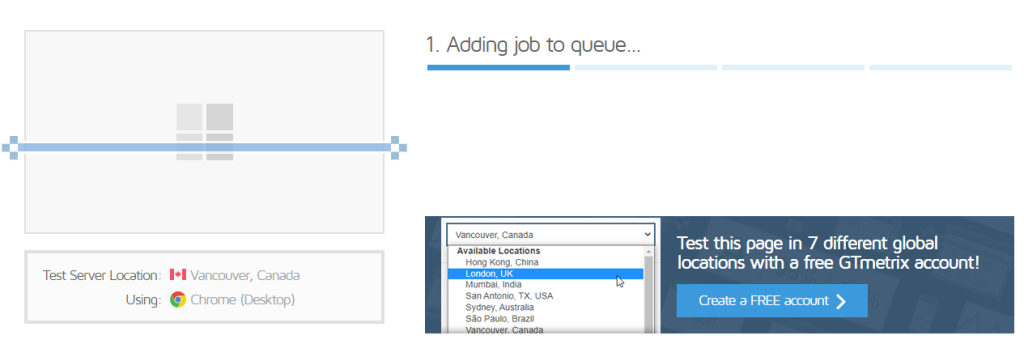
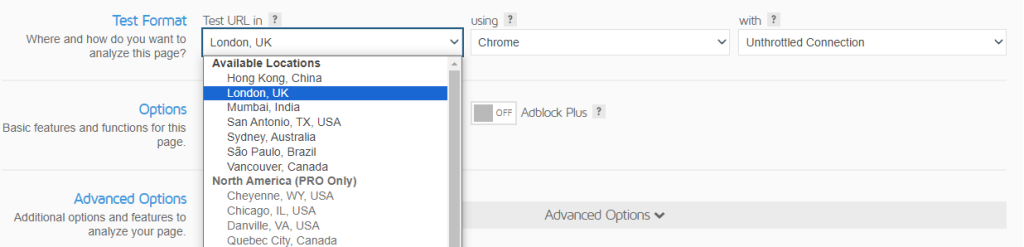
Simply select the ‘Analysis Options’ button located right below the ‘Analyze’ button, and then modify the location to your preferred choice.
Speed Optimization
Speed optimization of a website is a critical aspect of web development and online user experience. A fast-loading website not only enhances user satisfaction but also positively influences search engine rankings. Here’s a comprehensive guide on how to optimize the speed of your website:
- Optimizing Images and Media
- Minimizing HTTP Requests
- Leveraging Browser Caching
- Content Delivery Network (CDN)
- Optimizing Server Response Time
- Enabling GZIP Compression
- Minifying CSS, JavaScript, and HTML
- Eliminating Render-Blocking Resources
- Browser-Side Caching
- HTTPS and SSL
- Content Delivery Strategy
- Critical Path Analysis
- Accelerated Mobile Pages (AMP)
- Content Management System (CMS) and Plugins
- Server-Side Caching
Website speed optimization is an ongoing process. Regularly monitor your site’s performance, implement best practices, and keep abreast of the latest optimization techniques to ensure your website provides a fast, responsive, and user-friendly experience. Fast websites not only benefit your users but also contribute to improved search engine rankings and increased conversions. You can check this article on optimizing website performance here.
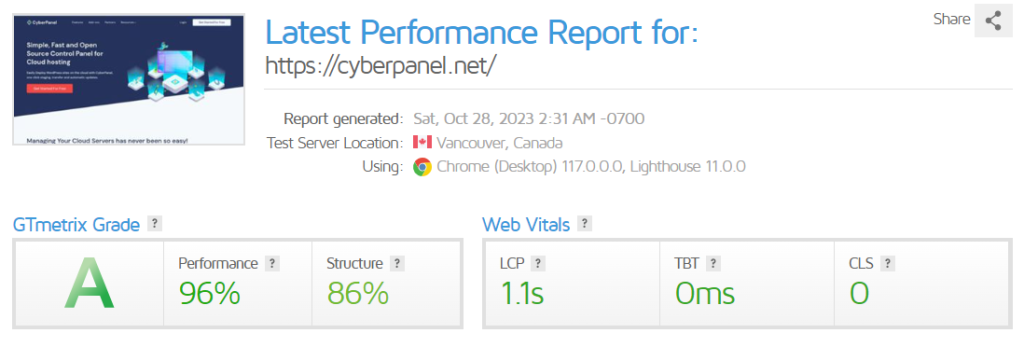
This is how you can test your site’s speed using GT matrics. Here you can see the performance, structure, LCP, TBT, and CLS of the website.
Summary of The Speed Test
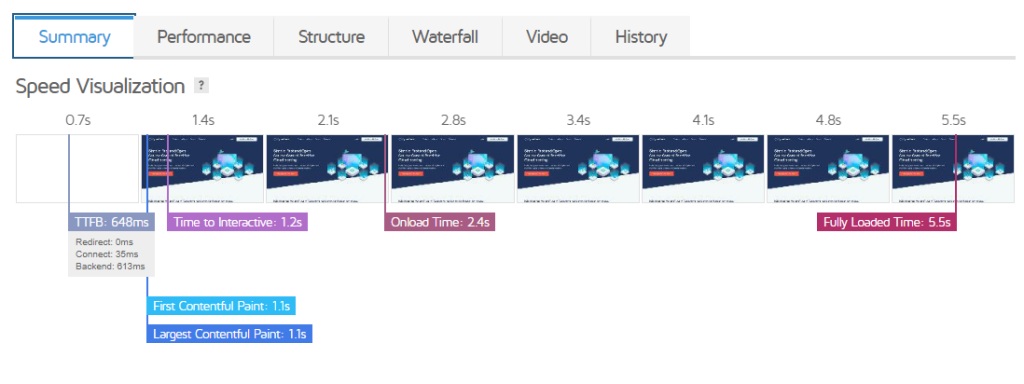
The summary section provides a concise overview of a website’s performance metrics. It includes key information such as the PageSpeed Score, YSlow Score, Fully Loaded Time, and Total Page Size. This section gives users a quick snapshot of their website’s speed and optimization levels, making it easier to gauge overall performance at a glance. Users can delve into more detailed information in other sections of the GT matrics report for specific recommendations and insights into areas that may require improvement. Below is the detail of all the tabs.
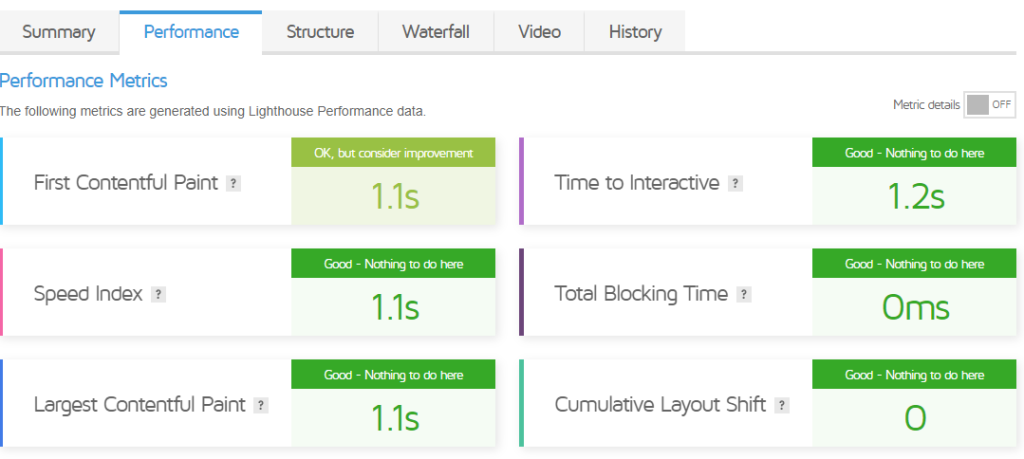
1. Performance
In the performance tab, the metrics that are generated using Lighthouse Performance data are first contentful paint (FCP), time to interactive (TTI), speed index, total blocking time, largest contentful paint (LCP), and cumulative layout shift (CLS).
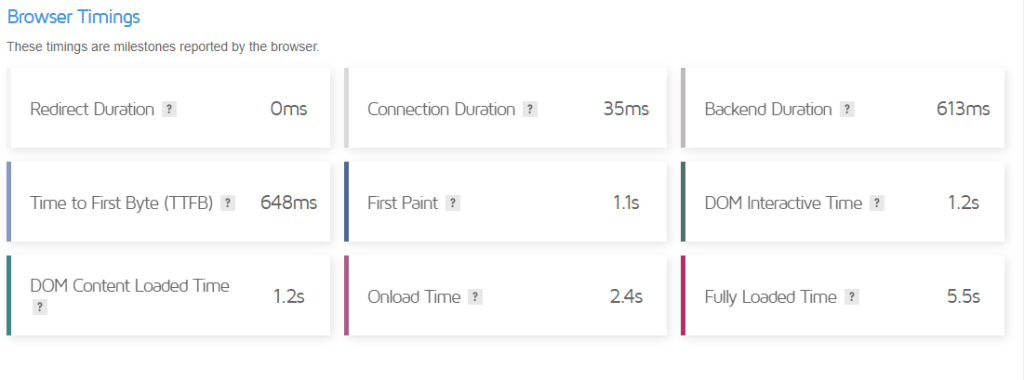
Below time markers are events tracked and recorded by the web browser.
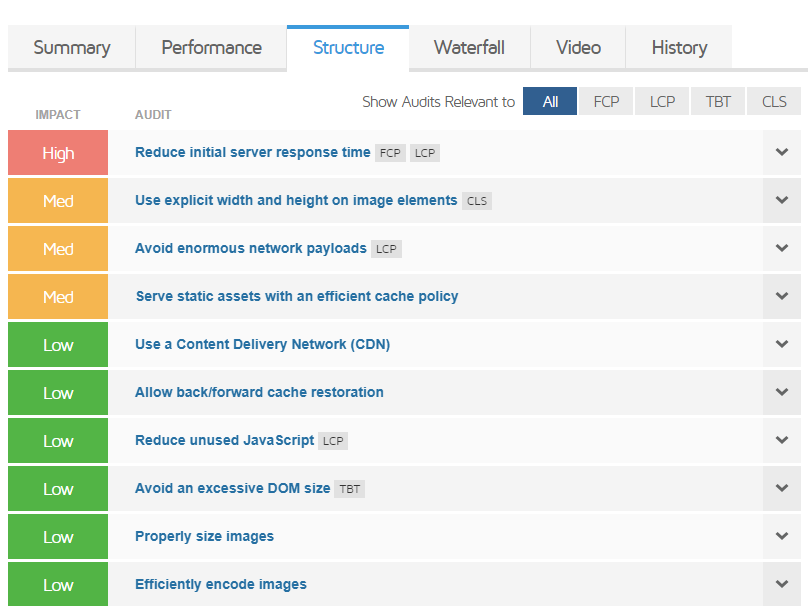
2. Structure
The “Structure” tab provides valuable insights into the necessary enhancements for your website’s optimization. It offers a detailed breakdown of specific areas that require improvement to enhance your site’s performance and user experience. This section serves as a roadmap, outlining the key aspects that need attention to boost your website’s speed and efficiency.
3. Waterfall
The waterfall chart in GT matrics is a visual representation of the loading sequence and performance of individual web page resources as they are fetched and displayed by a web browser. This tool provides a detailed breakdown of each resource, such as images, scripts, stylesheets, and other elements, showing when they start loading, how long it takes to load them, and any potential bottlenecks or issues in the loading process.
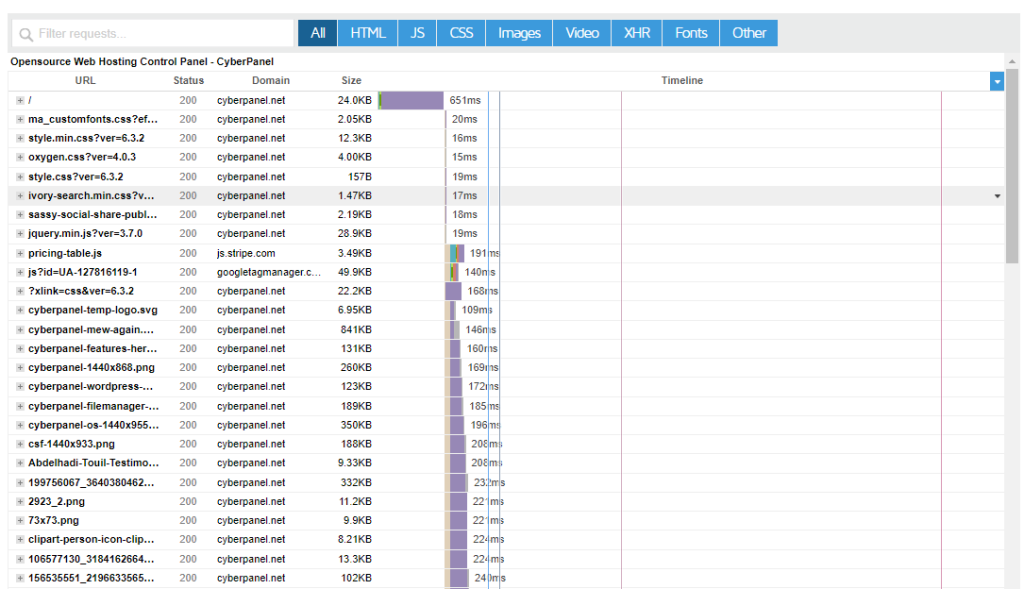
The waterfall chart is a powerful diagnostic tool that offers several key elements:

- Resource Timeline
Each resource is represented as a horizontal bar, and the chart displays a timeline from left to right. The leftmost side represents the start of the loading process, while the rightmost side indicates when the resource has fully loaded. - Resource Name
The chart labels each resource, making it easy to identify what is being loaded. You can see file names, URLs, and associated information. - Colors
The bars are color-coded to indicate the resource type. For example, HTML, CSS, JavaScript, and images may have different colors, helping you quickly identify resource categories. - Bars and Dependencies
Resources may have dependencies, and these dependencies are displayed as lines connecting the resources. This shows the order in which resources are fetched and whether there are any delays due to dependencies. - Timing Information
The chart provides information on when a resource is initiated, its download time, and any waiting periods or delays in the loading process. This information helps pinpoint which resources are causing performance issues. - Waterfall Timing Metrics
GT matrics offer a wealth of performance metrics for each resource, including details like “Start Render,” “DOMContentLoaded,” and “OnLoad.” These metrics give insight into critical milestones in the loading process.
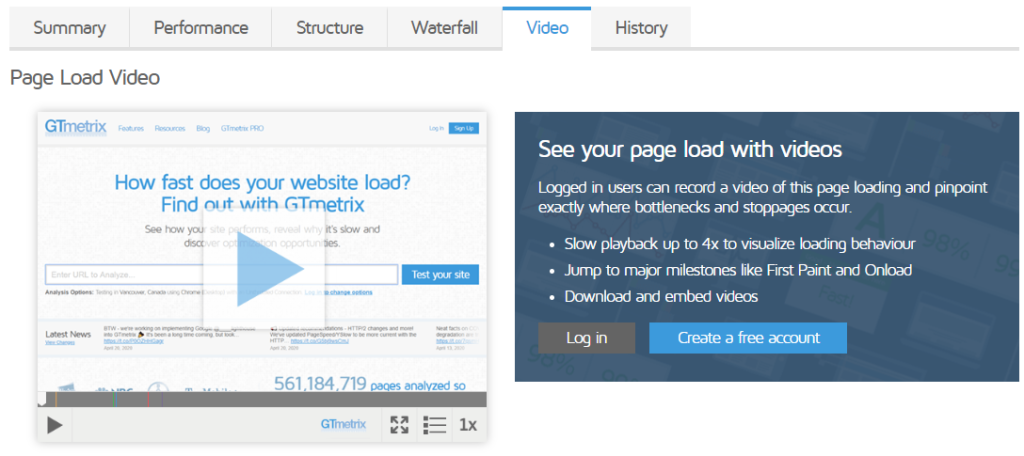
4. Video
This section displays a visual representation of the complete loading sequence, allowing you to observe the elements that consume more time during the loading process. Additionally, you have the option to download the video if you wish to document the website’s performance across each test.
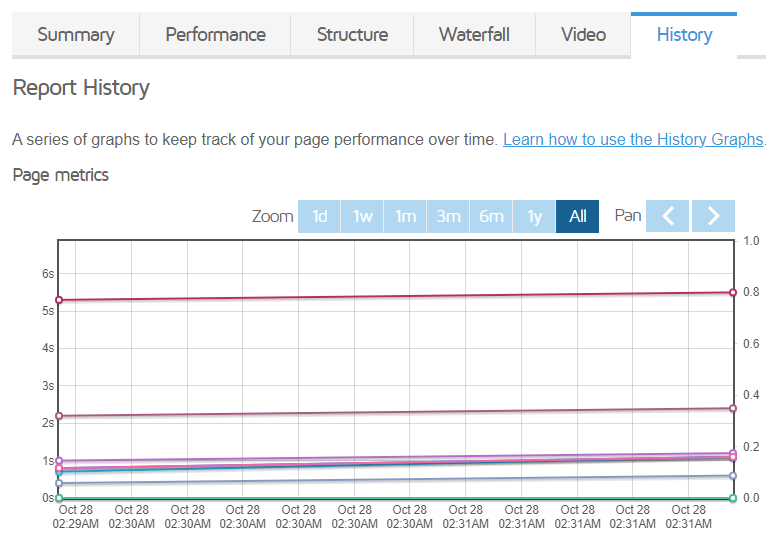
5. History
The history tab displays the test result history, enabling you to track variations in page load times, page size, and the PageSpeed and YSlow scores over time.
FAQs – GT Matrics
How do I use GT matrics?
Using GT matrics is simple. Visit the GT matrics website, enter your website’s URL, and click “Test your site.” You’ll receive a performance report with key insights.
What does the PageSpeed Score represent?
The PageSpeed Score is a performance metric provided by GT matrics based on Google’s PageSpeed Insights. It measures how well your website is optimized for speed and user experience.
What is the YSlow Score, and how does it differ from the PageSpeed Score?
The YSlow Score is another performance metric, but it’s based on Yahoo’s performance rules. It provides a different perspective on your website’s performance, focusing on various optimization criteria.
Can I change the test location in GT matrics?
Yes, you can change the test location by clicking on the “Analysis Options” button below the “Analyze” button. This allows you to test your website’s performance from different geographical locations.
How often should I test my website with GTmatrics?
It’s recommended to test your website regularly, especially after making significant changes. Regular testing helps you monitor performance over time and identify any issues that may arise.
Conclusion
In conclusion, GT Metrix is a valuable tool for website owners and developers seeking to optimize their web performance and user experience. By providing detailed insights into page speed, optimization scores, and actionable recommendations, GT Metrix empowers users to enhance their websites’ loading times and overall quality.
Related Content: Browser Caching Using Cloudflare