For containerized applications, you need Kubernetes observability to ensure that everything is healthy and performing correctly. With increasingly complex Kubernetes environments, we must have visibility into how our systems are behaving. This article explains the fundamental components of Kubernetes observability: what it is, tools and best practices, and challenges.
Let’s get started!
What is Kubernetes Observability?
Kubernetes Observability is the capacity to track, measure, and make sense of the internals of a Kubernetes system through some externalised output, logs, metrics, and traces. It allows teams to proactively address issues and guarantee system resiliency.
Observability within Kubernetes includes:
- Metrics: System-level quantitative information (eg, CPU, memory).
- Logs: A history of events or errors produced by applications and system parts.
- Traces: Log requests through the system in minute detail, the place where you generally find bottlenecks.
With these data sources combined, teams benefit from a holistic view of their Kubernetes clusters, leading to faster troubleshooting and optimized system performance.
What are the Key Kubernetes Observability Tools?
Several tools aid in achieving effective observability in Kubernetes environments:
| Tools | Functionality |
| Prometheus | Collects and stores metrics; supports alerting. |
| Grafana | Visualizes metrics through dashboards. |
| Jaeger | Provides distributed tracing capabilities. |
| Fluentd | Aggregates and forwards logs. |
| Elastic Stack | Offers log storage, search, and visualization. |
These tools provide a robust observability stack. It enables real-time monitoring and analysis of Kubernetes clusters.
How to Address the ‘Waiting for Deployment Spec Update to be Observed’ Issue?
The message “waiting for deployment spec update to be observed” indicates that Kubernetes is in the middle of processing a deployment update — the changes to the deployment have not been fully made yet.
To address this:
Check Deployment Status:
kubectl rollout status deployment/<deployment-name>This command returns the information on the progress of a deployment.
Describe the Deployment:
kubectl describe deployment <deployment-name>The deployment description can be reviewed to determine what events or errors are resulting in delays.
Inspect ReplicaSet and Pods:
Ensure that new ReplicaSets are created and pods are running fine.
When you have successively checked through these parts, you will be able to find the issue that is blocking the deployment from being detected.

Where Do Security and Observability Meet in Kubernetes?
Kubernetes security and observability are connected; the two are very much related, because observability gives you information that strengthens the security model.
Key intersections include:
- Anomaly Finding: Unusual patterns can be identified by observability tools as signs of possible security compromises.
- Audit Trails: Logs provide you with an audit trail, which is incredibly important for any kind of forensic analysis after an incident has occurred.
- Policy: It is responsible for making sure that security policies are being properly enforced throughout the cluster.
Security-focused observability provides both operational and threat resiliency to Kubernetes clusters, so they are not only performing but also secure.
What are The Best Practices for Kubernetes Observability?
Here are some best practices for Kubernetes observability:
Implement the Three Pillars:
- Metris: Leverage Prometheus to scrape system metrics.
- Logs: Collect logs aggregatively with Fluentd, and analyze logs with the Elastic Stack.
- Traces: Use Jaeger to trace requests across nodes.
Use Dashboards:
Create Grafana dashboards to be able to see your metrics in real time.
Set Up Alerts:
Set up Prometheus Alertmanager to alert teams to the most severe problems.
Automate Monitoring:
Embed observability tools in the CI/CD process to monitor and visualize continuously.
Regularly Review and Update:
Regularly review observability settings to reflect changes in the system.
All of this helps make Kubernetes clusters observable, which in turn helps with both proactive issue detection and system optimization.
Why is CyberPanel Important for Kubernetes Monitoring?
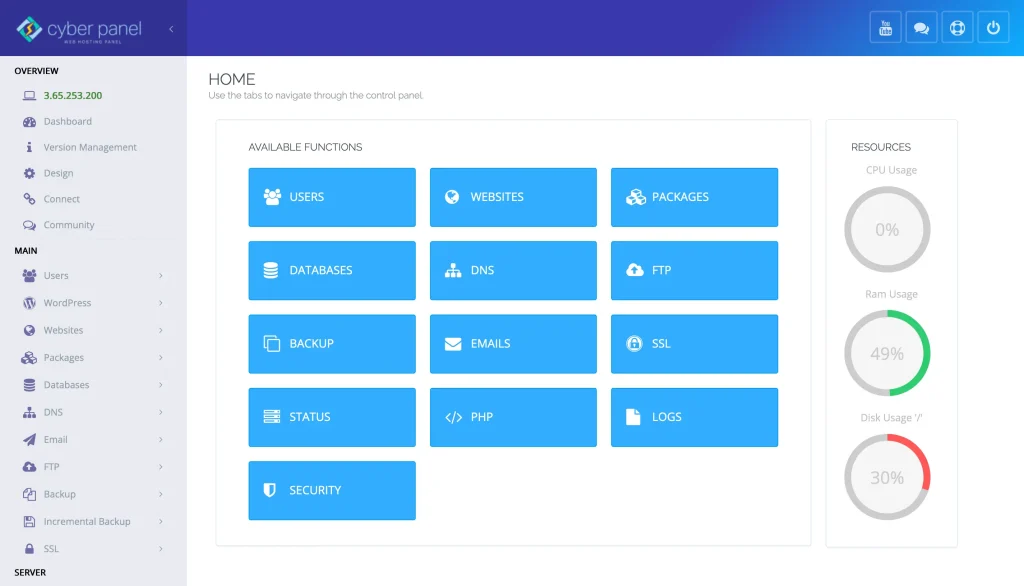
Though CyberPanel is a web hosting control panel, it still can support Kubernetes observability by:
- Log Management: CyberPanel is able to collect logs from different services in a centralized location , which is useful for analyzing the logs.
- Integration Monitoring: It is the way that it can be integrated with monitoring tools and have a single interface.
- Security Compliance: Security features of CyberPanel can be aligned with Kubernetes security to provide an extra layer of security.
By adding CyberPanel to your observability stack, you can take monitoring and control of your Kubernetes cluster to the next level.
FAQs About Kubernetes Observability
Q1: What is Kubernetes observability?
It’s the way of monitoring and analysing Kubernetes systems (like logs, metrics, and traces) to understand and improve performance and reliability.
Q2: What tools are crucial for Kubernetes observability?
Key tools would be Prometheus (where you have metrics), Grafana (for the visualization), Jaeger (tracing), Fluentd (log aggregation), and the Elastic Stack (log analysis).
Q3: What does observability do for Kubernetes security?
Observability helps detect issues and provides an audit trail and system to enforce security policies, which enhances the security of a cluster.
Q4: What is Kubernetes waiting for deployment spec update to be observed?
It means that the deployment update is happening, but has not been completed. You can check the deployment logs to see why.
Master Kubernetes Observability Today!
Kubernetes observability is essential to keep containerized applications strong, secure, and performing well. Thanks to some key tools and best practices, there are some deep works that teams can do in their systems that help with proactive problem solving and continuous improvements.
Start with observability today! Add observability to your Kubernetes workflow and make sure your apps are running smoothly and safely.