Have you ever wondered why your Linux system coughs under load? Or what goes on after your application starts with that horrible lag? Performance issues are very common, particularly in complex systems. Well, the bright side is that Linux Perf can be used to figure out where things are sliding.
Linux Perf is an abbreviation for Performance Counters for Linux, a tool embedded in the heart of the Linux kernel. It is of assistance to developers and sysadmins in performance monitoring, bottleneck discovery, and slowdown termination. It is most effective in latency debugging, CPU-hogging issues, or random crashes.
New in the field and system diagnostics? Fret not; this guide discusses performance events in Linux, usage of the Linux perf tool, and what to do if you see that an anomalous perf interrupt took too long error.
In this guide, I will show you around the basics: practical command-line usage with explanations that you should be looking for, spoiler alert: this is not for Linux wizards. By the end, you will be able to perform perf Linux tricks to keep your systems healthy.
What Is Perf_Event In Linux?
Perf_event is an interface in the Linux kernel that monitors certain components of the hardware and software performance. It measures the CPU cycles, cache hits, and instructions, among others. It is possible to collect and analyze performance data using tools like perf, which access data in the Linux kernel.
For What Is The Linux Perf Tool Used?
The Linux perf tool is used to collect the system and application data of execution in detail and is commonly referred to as the perf tool. It is able to determine which code segment is the biggest CPU consumer, the frequency of function calls, as well as the causes of usage slowdowns and upsurges.
You are able to profile applications, trace system events, or analyze kernel internals.
Common commands to use:
perf top
Shows real-time performance bottlenecks.
perf stat ./your_program
Shows CPU cycles, instructions, cache misses, etc.
perf record ./your_program
perf report
Captures performance data and gives a breakdown of where time was spent.
How To Resolve The ‘Linux Perf Interrupt Took Too Long’ Issue?
It indicates that the system failed to handle a hardware interrupt in a timely manner. This issue is common during periods of high CPU activity or when perf is executed on heavily loaded systems.
Actions to take include:
- Lower system load
- Increase the priority of the interrupt
- Do not run parallel compute-heavy jobs
- Update kernel drivers if they are outdated
You can also monitor interrupts using:
watch -n 1 cat /proc/interrupts
When Should Linux Perf Be Used?
Use Linux Perf when your application or system is sluggish, as it works best for debugging issues, especially high CPU usage problems, measuring performance indicators, and real-time profiling of processes.
It enables system administrators and developers to optimize the application and kernel for better performance.
Best Practices for Linux Perf
- Start with perf stat: A quick overview of the system’s operation.
- Data collection with perf record: Data is saved and later analyzed with perf report.
- Work on Hotspots: Use focus with flame graphs or call stacks where the action is.
- Prevent Noise: Use filters to ignore all but the specified processes or threads.
Real Example: Measuring CPU Cycles
Let’s say you have a C program called main.c compiled as main.out. You want to see how much CPU it uses.
perf stat ./main.out
Output:
 1,234,567 cycles                    # CPU cycles used
 890,123 instructions               # Instructions executed
 1.39 instructions per cycle
Functions of CyberPanel

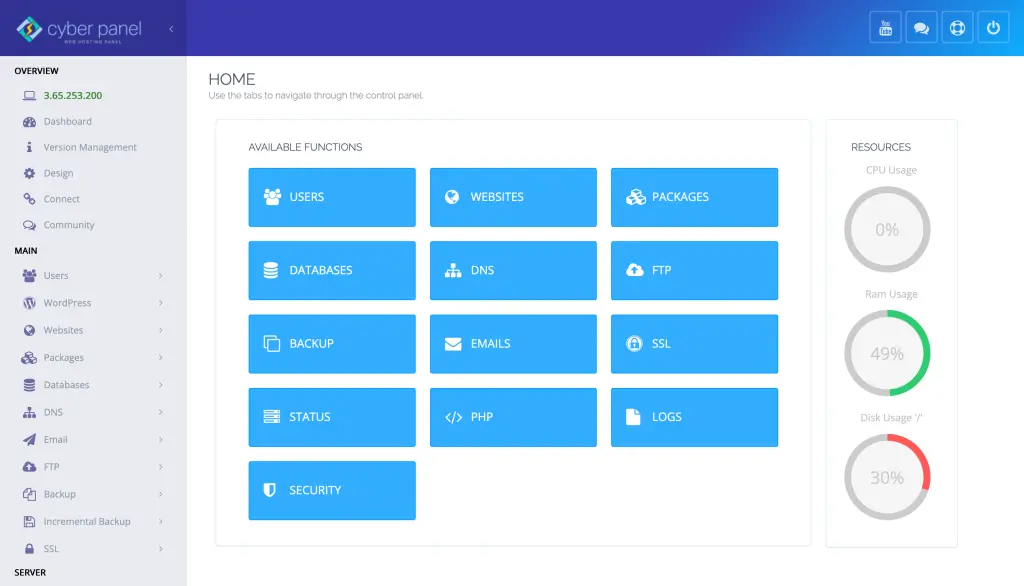
Although CyberPanel is mainly a web hosting control panel, it operates on Linux and provides SSH access to the server. This allows the installation and usage of Linux performance monitoring tools, for example, perf on CyberPanel-powered servers.
CyberPanel allows:
- Admin tasks on Linux.
- SSH access to the server and execution of performance monitoring tools.
- Under real traffic, performance monitoring of the application.
- Backend services optimization for enhanced agility.
CyberPanel provides a streamlined approach to server management while granting access to advanced tools such as perf.
FAQs
Is the Linux perf tool included in the system by default?
It is a part of the standard toolset in almost all contemporary Linux distributions. If it is missing, you can download it using the appropriate package manager (apt, yum, etc.).
Is root access required to utilize perf?
Not in all scenarios, but for some system-level events, you would require root access.
What are perf record and perf report?
Perf record captures the data, and perf report analyses it.
Culmination
The Linux perf tool is one of the most powerful tools for diagnosing system and application performance issues. Mastering the use of perf on Linux will definitely take your skills to the next level.
Performance shouldn’t be ignored; it should be understood, enhanced, and engineered to build superior systems.
Ready to optimize your Linux performance? Try the perf tool today and see your system like never before!


