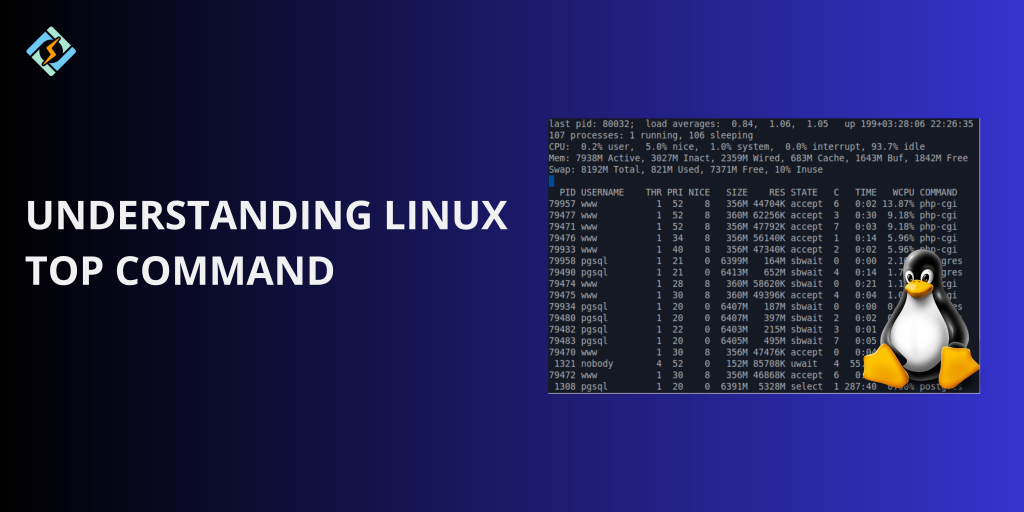
Linux top command is a powerful system monitoring tool that shows real-time insights into system resource usage, including CPU, memory, and running processes. It helps point out the system issues, monitor performance, and manage processes efficiently.
Key features of the Linux top command include:
- Displays real-time CPU and memory usage.
- Lists active processes and their resource consumption.
- Allows sorting and filtering of processes by different parameters
- Continuously updates on default every 3 minutes.
- Provides dynamic options for managing and killing processes.
Linux Top Command: Syntax & Usage
Linux top command is used to system performance, active processes, CPU usage, and memory consumption among other system statistics.
Syntax:
top [options]
By default, running top without any options will display a continuously updating list of running processes and system statistics.
Basic Usage:
- Run top command. This opens an interactive interface showing system metrics and running processes.
- Sort by CPU usage:
top -o %CPU
Displays processes sorted by CPU usage in descending order.
- Sort by memory usage:
top -o %MEM
Lists processes using the most memory first.
- Show processes for a specific user:
top -u username
Displays only the processes running under the specified user.
- Change update interval:
top -d 5
Updates the display every 5 seconds instead of the default 3.
- Kill a process from top:
Press k, enter the PID of the process, and confirm.
- Exit top:
Press q to quit the top command interface.
Related Article: How to Use the tee Command in Linux – Why It’s Essential
Commonly used Linux Top Command Options
| Option | Description | Example |
| -d N | Sets the update interval to N seconds. | top -d 5 (updates every 5 sec) |
| -o FIELD | Sorts processes by a specific field. | top -o %CPU (sort by CPU usage) |
| -u USER | Displays processes of a specific user. | top -u root (show root user processes) |
| -p PID | Displays details of a specific process. | top -p 1234 (monitor process 1234) |
| -n N | Runs top for N iterations, then exits. | top -n 10 (run for 10 cycles) |
| -b | Runs top in batch mode (non-interactive). | top -b -n 1 > output.txt |
| -c | Toggles between command name and full command line. | top -c |
| -H | Shows threads instead of processes. | top -H |
| -i | Ignores idle and zombie processes. | top -i |
Interactive Keyboard Shortcuts for Linux top command
Use these shortcut keys for Linux top command functions;
| Shortcut | Function |
| q | Quit top and return to the command line. |
| h | Show help menu with all available commands. |
| Space | Refresh the display immediately. |
| d | Change the update interval (default is 3 sec). |
| M | Sort processes by memory usage. |
| P | Sort processes by CPU usage. |
| N | Sort processes by process ID (PID). |
| T | Sort processes by runtime (time+). |
| U | Filter processes by a specific user. |
| k | Kill a process (enter the PID when prompted). |
| r | Change the priority (nice value) of a process. |
| z | Toggle color display mode for better visibility. |
| c | Toggle between showing only the command name and the full command line. |
| f | Customize displayed columns (add/remove fields). |
| x | Highlight the sorted column for better readability. |
| i | Hide idle and zombie processes. |
| H | Show threads instead of processes. |
| 1 | Toggle CPU usage display for individual cores. |
Practical Examples of Using top Command
Below are some practical use cases and command examples that help you analyze system resources effectively.
1. Display Real-Time System Stats
Run the Linux top command without any options to see a real-time view of the processes, CPU usage, and memory usage.
top

This opens an interactive interface that updates every few seconds.

2. Sort Processes by CPU Usage
To find the mostCPU-intensive processes, press P while top command is already running, or use:
top -o %CPU
3. Sort Processes by Memory Usage
Identify the processes consuming the most RAM with the shortcut M, or the command:
top -o %MEM
4. Monitor Processes of a Specific User
To display only processes belonging to a particular user, such as Sara, use command:
top -u sara
5. Change Update Interval
Top updates after every 3 seconds by default, to change the intervals, use:
top -d 5
6. Display a Specific Process
Monitor a particular process using its process ID:
top -p 1234
Replace 1234 with the actual PID.
7. Kill a Process from top
To terminate a process, press k, enter the PID, and confirm with ENTER or use the command:
kill -9 <PID>
8. Hide Idle and Zombie Processes
To filter idle processes, press i inside top:
top -i
9. Display Threads Instead of Processes
To view all the threads running on the system, use command:
top -H
10. Save top Output to a File
For later analysis, you can run Linux top command in batch mode:
top -b -n 1 > top-output.txt
This captures a single snapshot and saves it to top-output.txt.
Alternative Tools to Linux Top Command for System Monitoring
While Linux top command is a powerful system monitoring tool, there are several alternatives that provide more detailed insights and better visualization.
1. htop – Interactive and User-Friendly Process Viewer
htop has a more intuitive interface, color-coded statistics, and better usability. It has a scrollable process list for more visibility and supports mouse interactions.
sudo apt install htop
sudo yum install htop

2. atop – Advanced System and Process Monitoring
atop provides detailed reports on CPU, memory, disk, and network usage, making it ideal for performance analysis.
sudo apt install atop
sudo yum install atop

3. glances – Comprehensive System Monitoring Tool
glances is a cross-platform tool that provides real-time monitoring of CPU, memory, disk, and network usage.
sudo apt install glances
pip install glances

4. nmon – Performance Monitoring and Tuning Tool
nmon provides detailed performance analysis of CPU, memory, network, and disk usage in a single view.
sudo apt install nmon
sudo yum install nmon

5. btop – Modern and Graphical System Monitor
btop is a visually appealing alternative to top, featuring an intuitive interface and smooth animations.
sudo apt install btop

6. vmstat – CPU, Memory, and I/O Monitoring
vmstat provides a lightweight way to monitor CPU usage, memory, and disk I/O statistics.
vmstat 2 5

7. iostat – Disk Usage Monitoring
iostat is part of the sysstat package and focuses on monitoring CPU and disk usage.
sudo apt install sysstat
iostat


8. sar – System Activity Report
sar collects, reports, and saves performance metrics over time, making it useful for historical analysis.
sudo apt install sysstat
sar -u 5 10

9. ps – Snapshot of Active Processes
ps is a simple but powerful command to check running processes. Unlike the top, it shows a static snapshot.
ps aux

Conclusion: Optimizing System Performance with top
Linux top command is an essential tool for system administration and provides real-time insights into the system performance. By monitoring CPU usage, memory consumption, and running process, top identifies resource blockers and optimize application performance.
1. How can I kill a process using top?
Press k, enter the Process ID (PID) of the target process, and confirm with ENTER.
2. How do I display top results in batch mode?
Use top -b -n 1 > output.txt to save the output to a file for later analysis.
3. How do I monitor only a specific user’s processes?
Run top -u username to filter processes by a specific user.