PHP debugging often feels like finding a missing piece of the puzzle. Say good-bye to manually tracing errors or var_dump() — that’s no longer the best tool to catch bugs in your code! What is a Debugger used for in “PHPThe debugging” output is an indispensable tool that revolutionizes the plumbing and tweaking of your code as a developer, subsequently flattening the debugging process by making it faster, smarter, and better.
In this guide, we’ll explain the importance of using a PHP debugger, particularly a powerful Xdebug PHP debugger, how to enable step debugging in popular IDEs like PHP Storm and the VSCode, and compare the best PHP debugging tools available on the market. Now, let’s get into the debugging magic and turn your coding experience around!
Why Do You Need a PHP Debugger?
A PHP debugger gives you insight into how the code you wrote runs by enabling variable tracking, stack tracing, and pinpointing bugs down to the line.
Here is why use a PHP debugger over manual debugging:
Many developers start debugging their code by printing values of variables, using die() statements in their scripts. These methods are effective for small projects but become impossible to manage in large applications. Below is how a PHP debugger simplifies life:
- Detects Another Emerging Object: Stop execution of the code at a breakpoint and inspect it line-by-line.
- Variable Inspection: Investigating the status of variables anytime during execution
- Debugging: Isolate effectively the locations where the errors are generated without looking for them through the entire codebase.
- Profiling tools: Helping with performance — Also like Xdebug PHP debugger offers profiling features that let you track down performance bottlenecks.
To sum up, a PHP debugger is a real time-saver that helps developers streamline their workflow techniques and write better, error-free code.
Comparing Top PHP Debuggers
PHP developers have no shortage of debugging tools to choose from, but not all tools are built the same. Let’s dive into the best PHP debuggers out there, and what makes them unique.
Xdebug PHP Debugger
Xdebug – The Best Debugging Tool for PHP. This open-source tool has all that the developer wants: from step debugging to performance profiling.
Top Features of Xdebug:
- Step Debugging: Lets you break the execution of your code at certain points and inspect what is going on.
- Profiling: Generates performance reports to optimize your application.
- Stack Traces: Provides more context about the function calls and errors allowing you to track what lead to the error at hand.
- Test Coverage Analysis: Indicates the code lines executed during your tests and helps identify untested portions of code (if any) in your application.
Whether working with PHP Storm or VSCode, Xdebug is easily integrated into your workflow, making it the best PHP debugger for VSCode, among other popular integrated development environments.
Zend Debugger
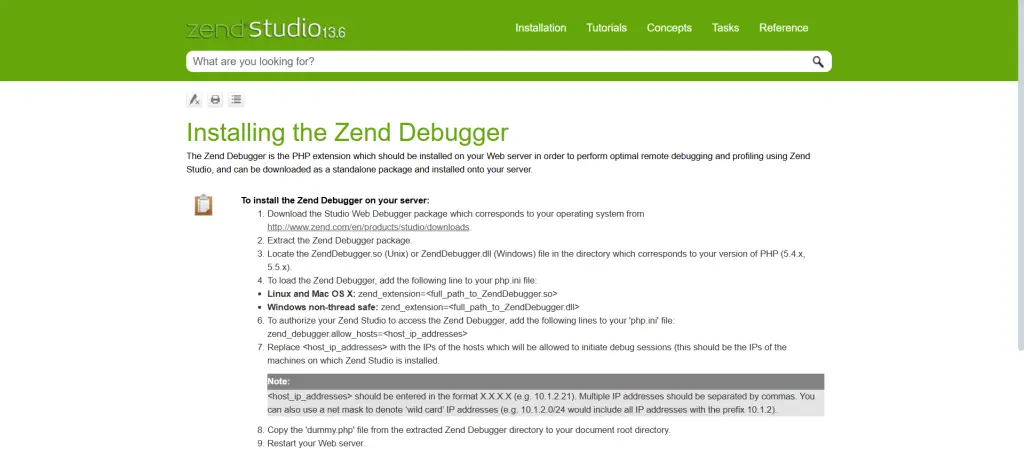
Another powerful tool available in this list is Zend Debugger, best suited for Zend Studio PHP developers. From some perspective Xdebug has more features while as per others, it beats Xdebug in terms of providing real-time debugging for live servers.
Why Choose Zend Debugger?
- Native support for Zend Studio.
- Charming, configuration-friendly implementation.
- Great for troubleshooting production setups.
Debug Bar
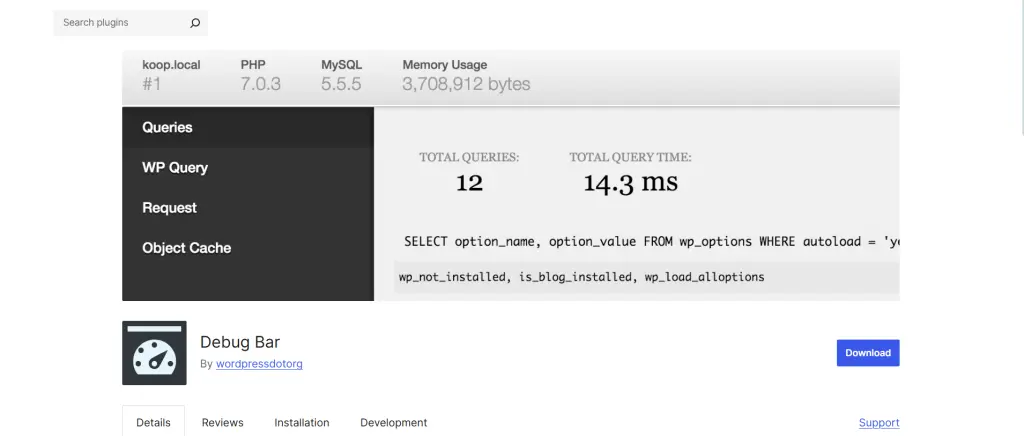
Debug Bar is a lightweight solution for those who like a less-complex debugging option. It is particularly favored by WordPress developers, as it can be used as a plugin.
Key Features:
- Show PHP errors and warnings as they happen
- It monitors database queries, memory usage and others.
- Intuitive, simple to install and get up and work with, even for novice users.
Other Notable PHP Debuggers:
- Whoops: a beautiful error handler with stack traces.
- PHP Console: Chrome extension for receiving logs and errors in Chrome and errors from server directly in the browser.
- FirePHP: Debug your PHP apps right from the browser console.
How to Use Xdebug with step debugger in PHP storm and VSCode
Enable Step Debugging in PHP Storm
In order to utilize the full potential of the Xdebug PHP debugger, you will have to configure step debugging in your IDE. This is how to “Xdebug enable step debugger PHP storm”:
Install Xdebug:

You can adapt a bunch manager such as PECL or direct troubled to the official Xdebug website.
Configure php.ini:
Let’s add the lines given below to your php. ini file:
zend_extension="path/to/xdebug.so"

xdebug.mode=debug

xdebug.start_with_request=yes

xdebug.client_port=9003
Set Up PHP Storm:
- Preferences -> Languages & Frameworks -> PHP
- Setup your PHP interpreter with Xdebug enabled.
- Configure a server mapping to tailor your local files to server paths
Start Debugging:
Set breakpoints in your code, run the debugger and watch the magic happen.
How to Setup Xdebug for PHP Debugger in VSCode
Xdebug runs like a charm with Visual Studio Code, one of the most popular code editors among developers. So how do you setup master PHP debugger with VSCode?
Install PHP Debug Extension:
Now go to the VSCode marketplace and download the “PHP Debug” extension.
Update php.ini:
Configure Xdebug in the php. ini file as follows:
zend_extension="xdebug.so"

xdebug.mode=debug

xdebug.client_port=9003
Configure launch.json:
Set up a debugging configuration in VSCode, in launch.json file:
{

  "version": "0.2.0",

  "configurations": [

    {

      "name": "Listen for Xdebug",

      "type": "php",

      "request": "launch",

      "port": 9003

    }

  ]

}
Start Debugging:
Place breakpoints, execute your PHP scripts, and debug right from within VSCode.
Why Developers Should Choose Xdebug
When it comes to PHP debugging, Xdebug is the winner time and again. This combination of powerful features, strong compatibility with leading IDEs, and being supported by a strong community makes it the best choice for PHP developers.
So whether you’re searching for the best PHP debugger for VSCode when debugging in PHP Storm, you can keep it simple with Xdebug which allows robust functionality.
PHP Debugging: Understanding CyberPanel’s Role
CyberPanel is an advanced web hosting control panel that has LiteSpeed Web Server and OpenLiteSpeed built-in, and it appeals to developers and system admins. CyberPanel has primarily aimed its sights on making your life easier by simplifying server management, but it’s also an essential tool that plays a vital role when it comes to PHP debugging by providing easy setup and management of various PHP configurations and tools like Xdebug.
So, here is how CyberPanel helps with PHP debugging:
Easy to configure PHP More php.ini
Using CyberPanel you can manage and configure PHP versions and settings directly from its friendly interface. This is especially useful when configuring debugging tools such as Xdebug PHP debugger, since you can:
Easy Switch: Instantly switch PHP versions on your server without having to configure them manually, keep your debugger aligned.
PHP Configuration: Adjust key parameters such as php. via CyberPanel dashboard for newly added.ini. Example: xdebug configuration.
zend_extension="xdebug.so"

xdebug.mode=debug

xdebug.start_with_request=yes
Easy Installation of Xdebug
You can install Xdebug PHP debugger on your server using CyberPanel. Xdebug Installation takes that much of the time when you implement it using the command line or the terminal of CyberPanel.
Xdebug Install Steps:
- Log into CyberPanel terminal
- Install Xdebug with your PHP version by typing commands like:
sudo apt-get install php-xdebug- Update your php. ini file in CyberPanel to set up Xdebug debugging and dump logging.
After installing Xdebug, CyberPanel conveniently assists in configuring it.
Simplified Remote Debugging
If you are a developer, you can use CyberPanel for setting up remote debugging on remote servers. How To Debug Remote PHP using Xdebug and CyberPanel Permissions
Remote Debugging CyberPanel, Steps:
Set up remote debugging mode for Xdebug in the php. ini file:
xdebug.client_host=<your-local-IP>

xdebug.client_port=9003- Set the debugging port to allow incoming connections in CyberPanel’s firewall settings.
- Have your IDE set (PHP Storm or VSC) to wait for the incoming xdebug connections.
- Doing so lets us debug applications running on a server managed by CyberPanel from our local development environment.
Real-Time Error Logs
Get PHP error logs and other info directly through CyberPanel instead of checking it in your cPanel. These logs augment Xdebug by exposing stack traces but also error and warning messages.
Seamless IDE Integration
CyberPanel is supporting remote debugging using IDEs such as PHP Storm and VSCode. So you need to configure Xdebug with CyberPanel. Open ports by connecting and syncing project directories for the better debugging experience.
Performance Optimization
Strengthened PHP performance via LiteSpeed and resource monitoring. It can make sure that during debugging your applications run efficiently.
FAQs
1. How does a PHP debugger help you out?
PHP Debuggers just before target troubleshooting, and they work by providing insights into what’s happening behind your code execution and lets you access the variable.
2. Why Xdebug is the best PHP debugger?
Xdebug allows you to debug your projects step-by-step, conduct profiling, and perform stack tracing and test coverage, making it perfect for every development need.
3. In PHP Storm how can I set Xdebug?
Configure Xdebug in php.ini to configure your PHP interpreter, and map server paths for step debugging.
4. Which PHP Debugger is the best for VSCode?
Xdebug works out of the box with VSCode by leveraging the PHP Debug extension as well as some configuration in launch. json.
Wrapping Up!
Xdebug PHP debugger and CyberPanel make PHP debugging hassle-free. These various tools not only helps to enable step debugging in IDEs like PHP Storm, VSCode but also assists in easing configuration and helping in performance optimization which helps developers in solving any code issue in a better way.
Ready to Level Up Your Debugging?
Start using CyberPanel and Xdebug together to develop more php codes in less time with zero errors. Debug better—start now!