
In this tutorial we will learn how to use Query Monitor plugin to find out the reasons for slow performing WordPress site.
Deactivating plugins until you find the bottleneck is usually the best way to identify a troublesome plugin.
However, there’s a more efficient and faster way to do it. In order to solve this issue, Query Monitor was created. Your WordPress site will become more efficient, you can debug performance issues, and you’ll gain a better understanding of your site.
What is a Query?
A ‘query’ is a request for information from a database. When WordPress asks for information from your database, it does it using a query.
Several queries are launched in the background when someone visits your website. You can do the following by keeping track of these queries:
- Determine which plugins or themes have the most impact on your website’s performance. Each query takes time, and the more requests a tool makes, the more influence it has on the performance of your site.
- Keep track of the resources you’re using. You can observe how much RAM you’re using and also how much of your information is successfully cached with some query monitoring tools.
- Boost your troubleshooting skills. You can troubleshoot a lot of difficulties more quickly if you know how to keep track of your queries. If a plugin isn’t operating properly, for example, it’s likely that a query isn’t triggering properly.
You can identify which plugins or themes are using the most resources by using query monitoring to improve your site’s performance.
What is Query Monitor?
Query Monitor is a free tool for debugging WordPress websites and assessing their performance. The application analyzes every request that is being made to the server including database queries, HTTP requests, hooks & actions, and so much more. Identifying a plugin, script, or database query contributing to a load time issue can be done through this tool.
You can use the Query Monitor plugin to determine whether performance problems with your website are due to obvious causes or whether they are due to a more complex issue.
Different features of Query Monitor?
Here are some features of Query Monitor:
- PHP Errors
- Theme Errors
- REST API
- AJAX Calls
- Authentication
- Privacy statement
Now let us look at these features in detail
PHP Errors
The PHP code is generated by either the theme or the plugin that generates a request in WordPress. Using PHP Errors, one can identify the component responsible for the error, as well as the location.
Theme Errors
All the queries triggered by the theme are listed by theme feature. The theme template name and hierarchy for each query is displayed. Additionally, it highlights the parts of the theme that have not been loaded yet as well as the name of the active theme.
REST API
The Query Monitor allows you to debug the information included inside an authenticated WordPress REST API request header if you have the permission. However, the plugin currently only shows PHP errors and memory usage.
AJAX Calls
Ajax is used by dynamic WordPress sites to send and fetch data in real-time without loading the entire web page. Query Monitor also provides related debugging information along with these requests. These details help developers identify errors more easily.
Authentication
WordPress Multisite’s super admin and the administrator of a single-site’s installation can view logs by default. Even when logged in as a user, you can view the logs using an authentication cookie.
Privacy statement
No data is collected or sent to third parties by WordPress Query Monitor which ensures the user’s privacy. This feature makes the plugin much more reliable and trustworthy.

The purpose of Query Monitor?
More than just WordPress queries can be debugged with Query Monitor.
As one of the major benefits of the plugin, Query Monitor is useful for debugging database queries.
It also covers debugging specific to performance and general development. Query Monitor has the major limitation that it is primarily used for “in-the-moment” debugging. The database queries are only shown for the current page load when it shows you the timing and so on.
How to install Query Monitor?
Installing Query monitor is super simple in WordPress.
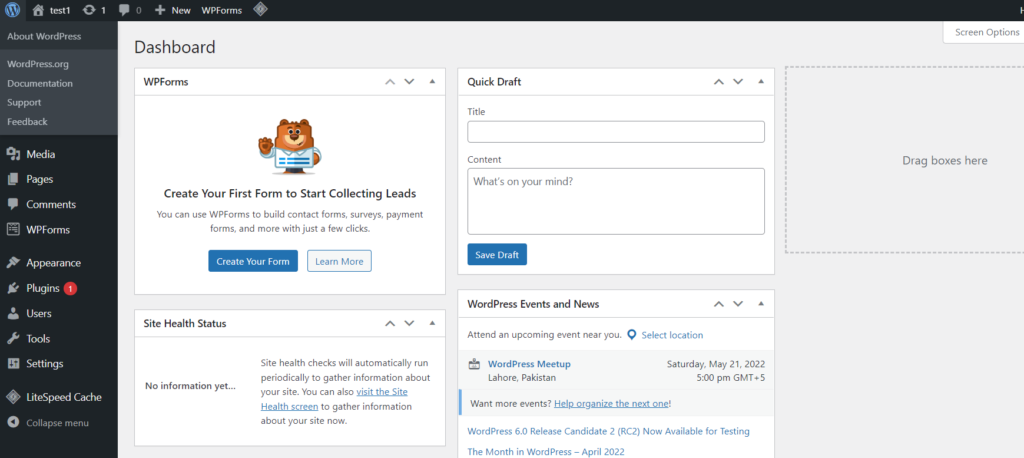
- Login to your WordPress dashboard
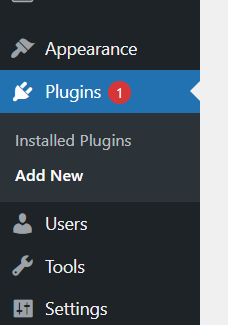
- Click on Plugins -> Add New from the left hand side menu
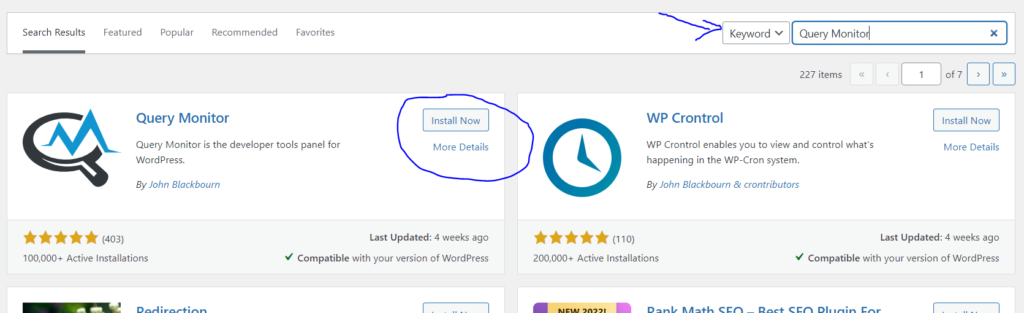
- Search for “Query Monitor” and Install and Activate.
How does Query Monitor work?
WordPress Query Monitor doesn’t have it’s own tab in the left menu or a separate interface. Rather it is displayed in the WP admin bar on both frontend and backend.
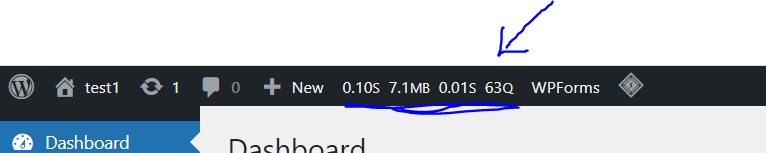
It initially displays only four pieces of information
- Page generation time
- Peak memory usage
- Total time taken by SQL queries
- Total number of SQL queries
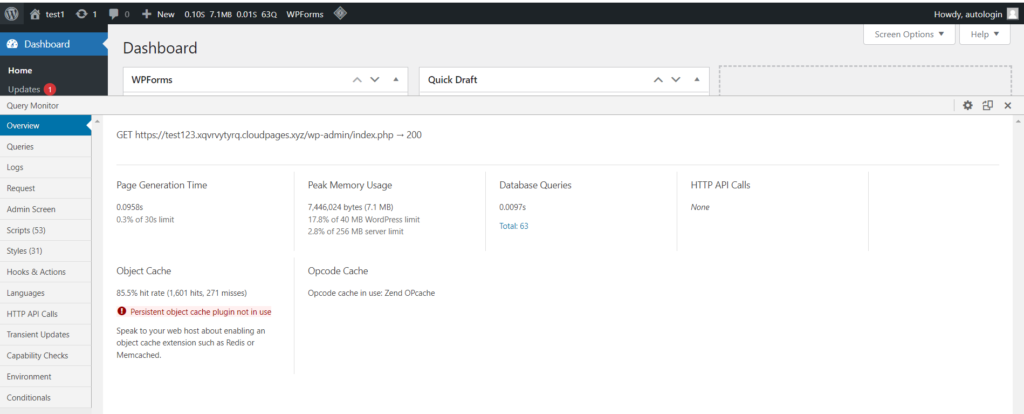
When you click on it, Query Monitor interface appears as a window overlay over the frontend and backend page. The query Monitor interface and its information are only visible to Administrators or Super administrators.
Now let us see these tabs in details
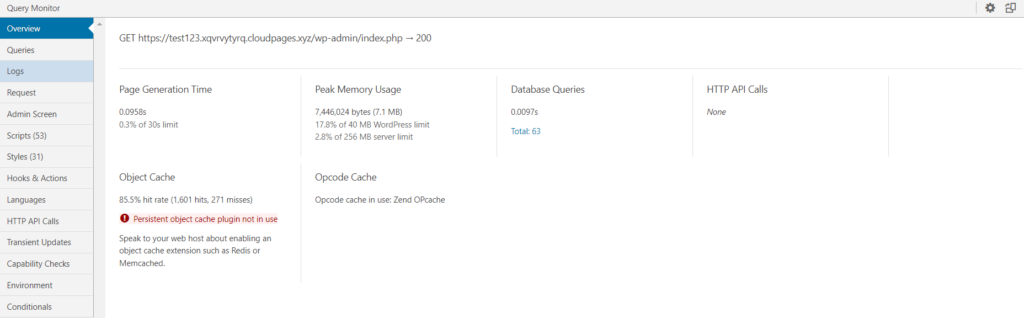
Overview
This tab displays additional information from the admin bar summary as well as some general environmental data/information. It is simply an overview.
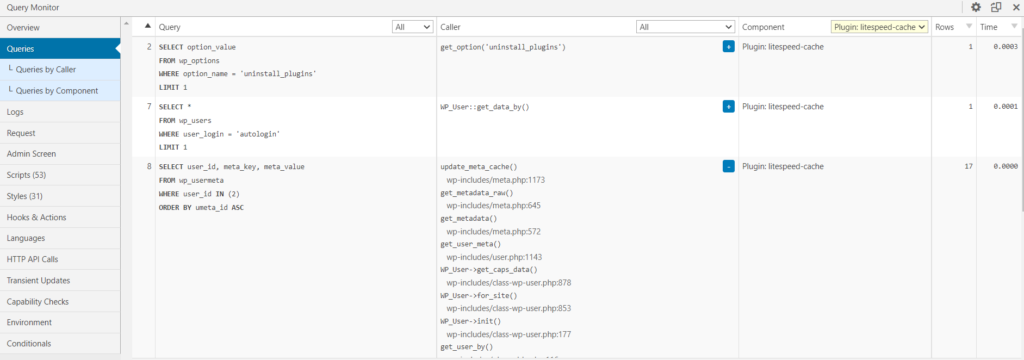
Queries
Queries tab allows you to examine each database query for the current page. it is one of Query Monitor’s most information-dense sections. you will see the following information.
- Query in full form
- Query caller
- Query component (whether it comes from core, theme, plugin)
- Number of rows
- The time that the query took
You may use this for a variety of things, like finding slow-loading queries that are slowing down your site’s speed.
Query Monitor will break down inquiries by theme and individual plugins so you can observe how each extension affects your site.
If you see abnormally low numbers here, it might be because of caching.
There are three sub menus:
- Duplicate Queries
To help you debug and streamline things, it shows duplicate searches and lists the “possible trouble maker”.
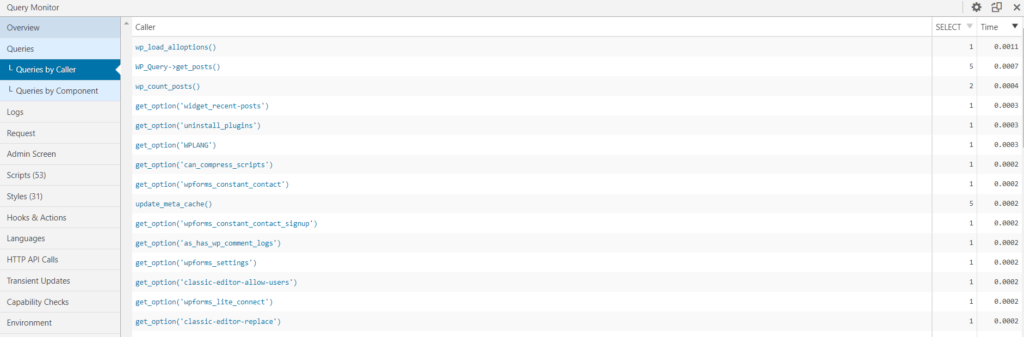
- Queries by caller
Allows you to see all of the callers on this page. If you select one, a list of queries for what caller will appear.
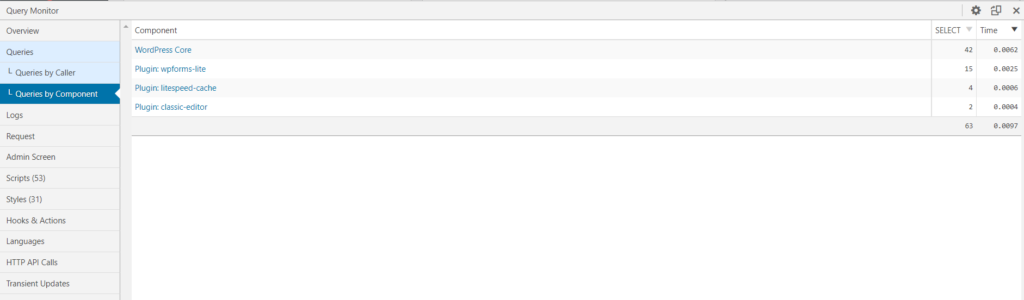
- Queries by component
Provides a list of all queries done by WP core, theme, and specific plugins.
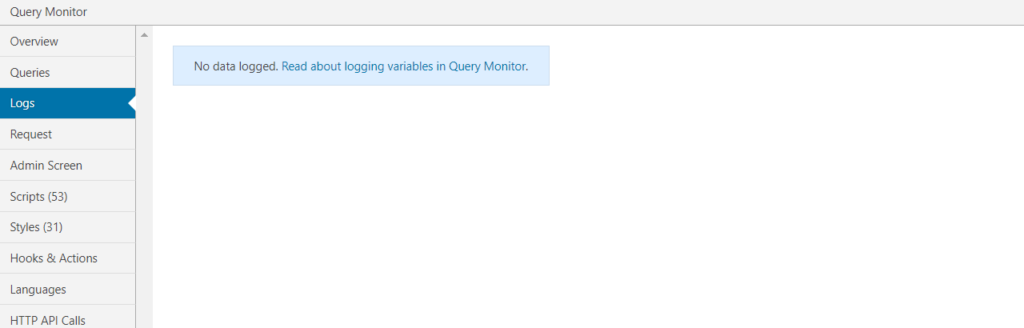
Logs
The log tab is a more advanced tab where you can log messages and variables. This might help you troubleshoot technical issues or monitor your site for issues.
This tab will be blank when you initially install Query Monitor since you will not have configured any logging variables.
Requests
The query variables for the current request are displayed in the main Request page. There are three sub menus
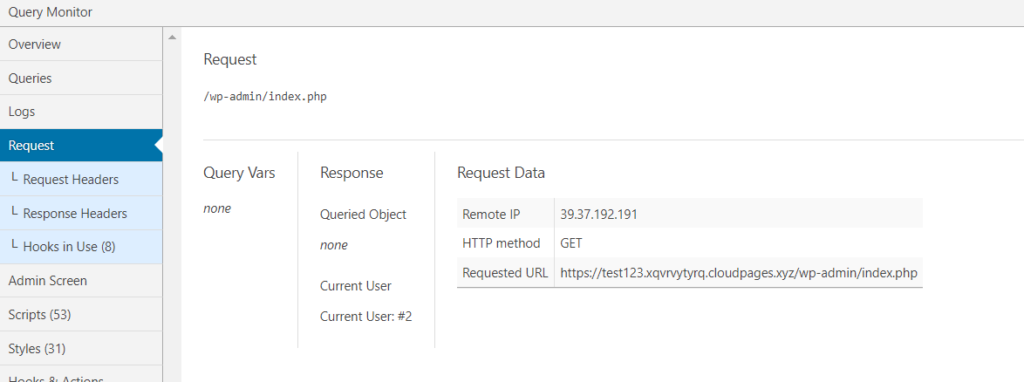
a. Request Headers
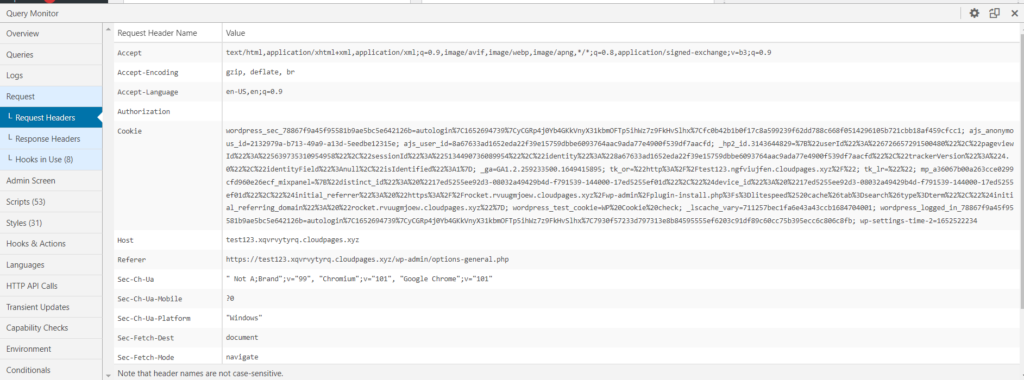
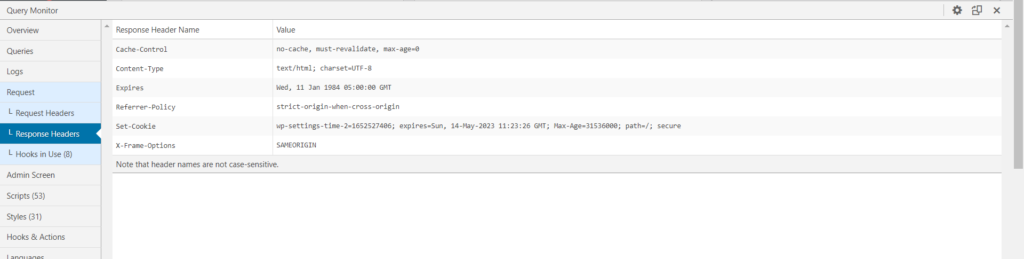
b. Response Headers
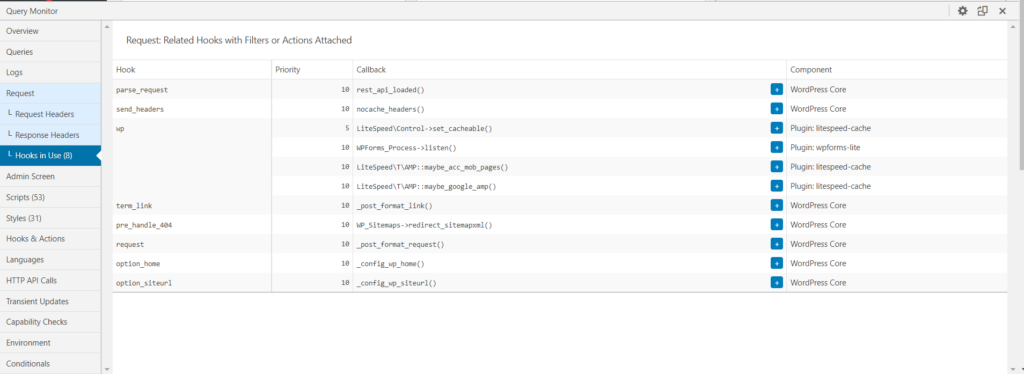
c. Hooks in use
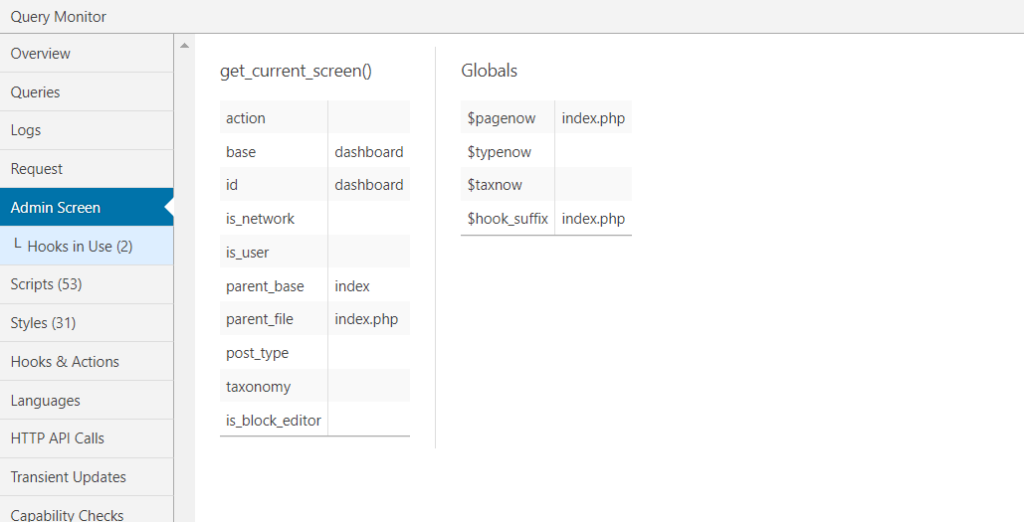
Admin screen
If you utilize Query Monitor in the WordPress admin dashboard, the Admin tab will appear. The custom filters and actions are visible when viewing an admin panel with a listing table. it also displays the current status of get_current_screen.
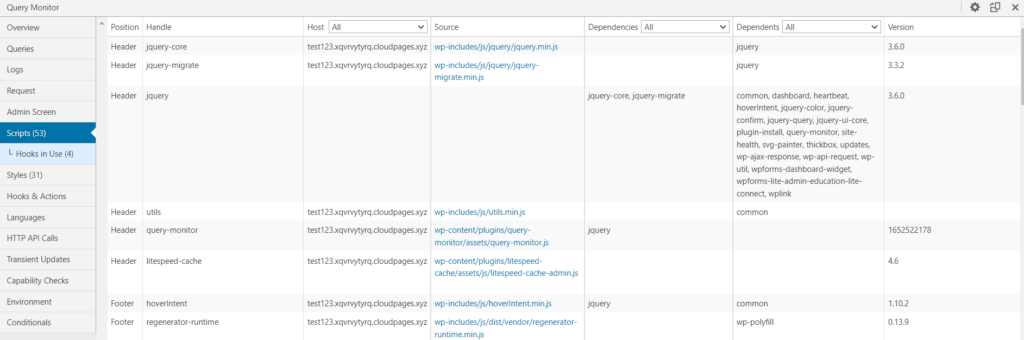
Scripts
The scripts tab is arguably the most useful performance troubleshooting area after the admin tab.
This tab shows all of the page’s enqueued JavaScript, as well as their dependencies and dependents. You may also filter to identify scripts from a certain host or those that have explicit dependencies/dependents.
More scripts, on the whole, imply a slower website because they increase page size and add HTTP requests. This tab can be used to investigate the effects of various extensions and to identify strategies to reduce the amount of enqueued scripts that load on each page.
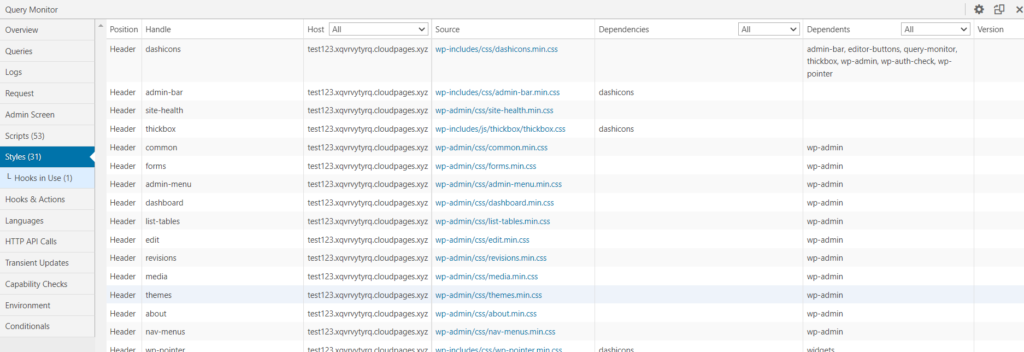
Styles
The Styles tab is similar to the Scripts tab, but instead of JavaScript, it displays enqueued CSS. It’s yet another useful tab for debugging your site’s performance.
Loading additional stylesheets on a page, similar to scripts, results in a slower loading site.
You can use this information to limit the number of stylesheets that need to be loaded on the website, resulting in smaller files and fewer HTTP requests.
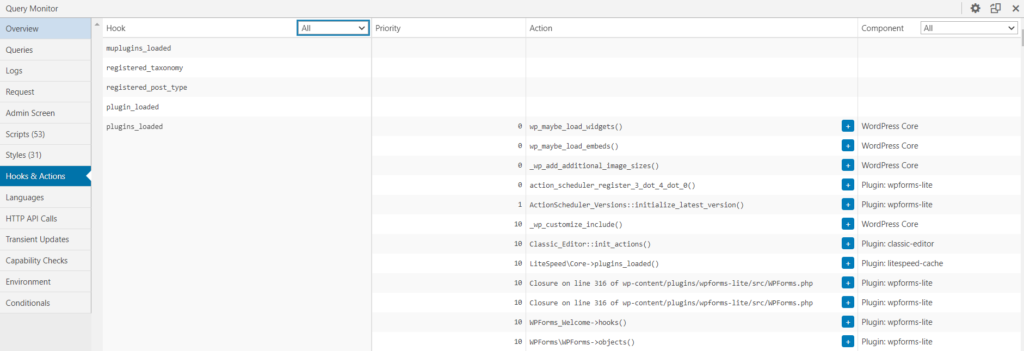
Hooks and Actions
The Hooks & Actions tab displays all of the current page’s hooks and actions, along with their priority.
When it comes to actions, you may expand each one to see the actual file and line of code connected with it. You can also search for actions from the WordPress core, plugins, and themes by component.
This region isn’t particularly performance-oriented, but it is useful for bespoke development.
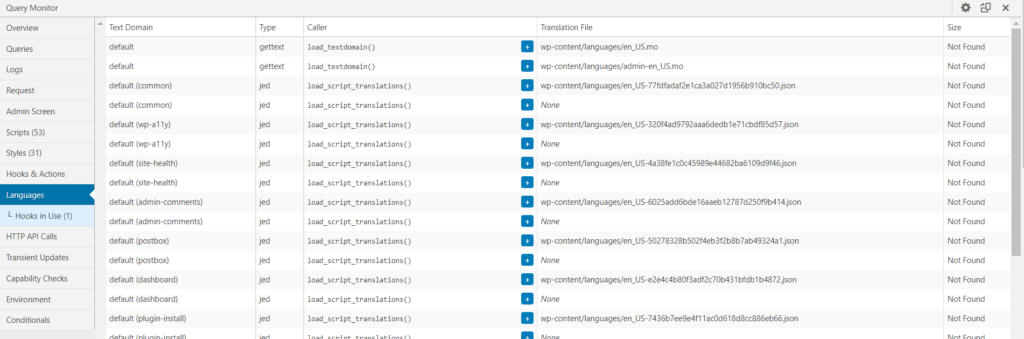
Languages
The Languages tab displays your site’s language and text domains, as well as the language file for each extension.
If you have a multilingual site and/or your site is in a language that does not have full translation pack coverage, this tab can be useful.
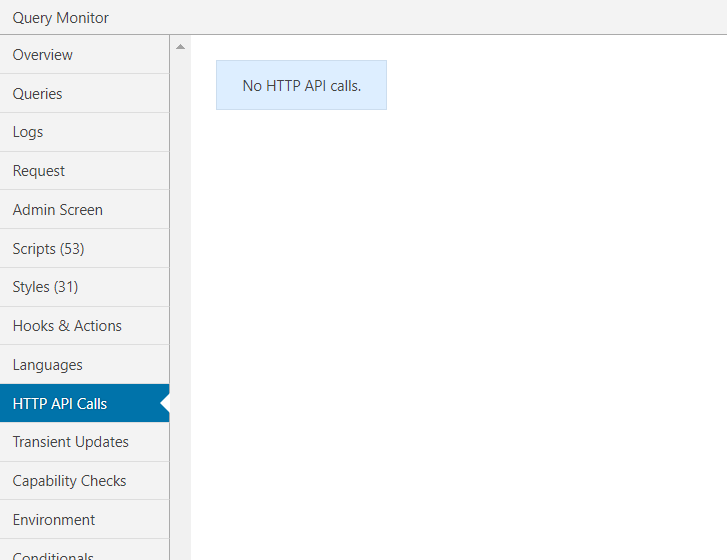
HTTP API calls
provides the request details, time, and HTTP status code for all server-side HTTP requests made during the page load.
“No HTTP API calls” should appear on numerous pages, which is a good indicator because it suggests nothing is interfering with your site’s performance.
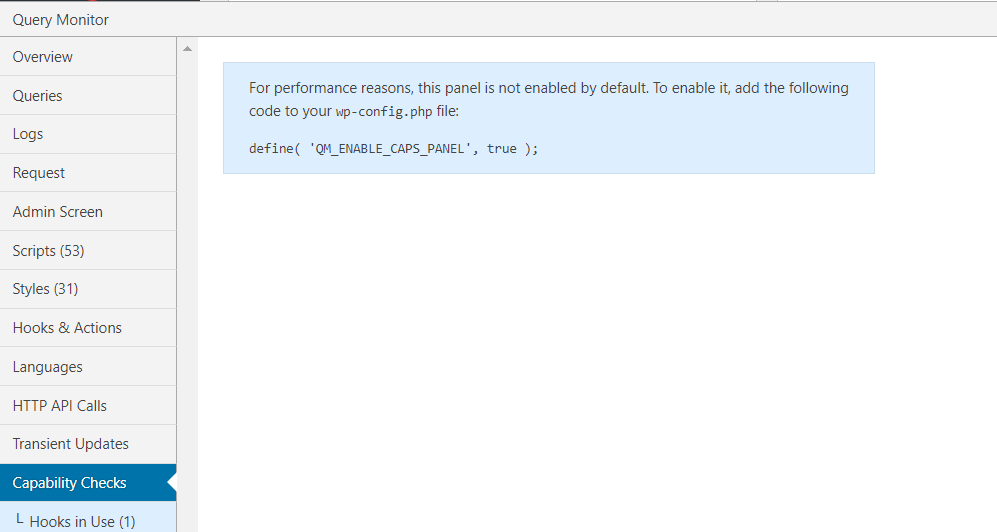
Capability Checks
The Capability Checks show you which user capabilities have access to the current content you’re viewing. This can be useful for determining whether different users have access to different front end or back end material.
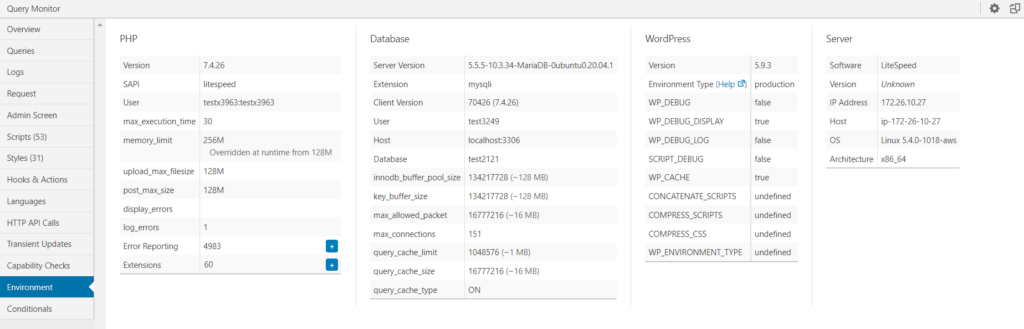
Environment
This tab gives you a comprehensive overview of your site’s environment including
- PHP
- Database
- WordPress
- Server
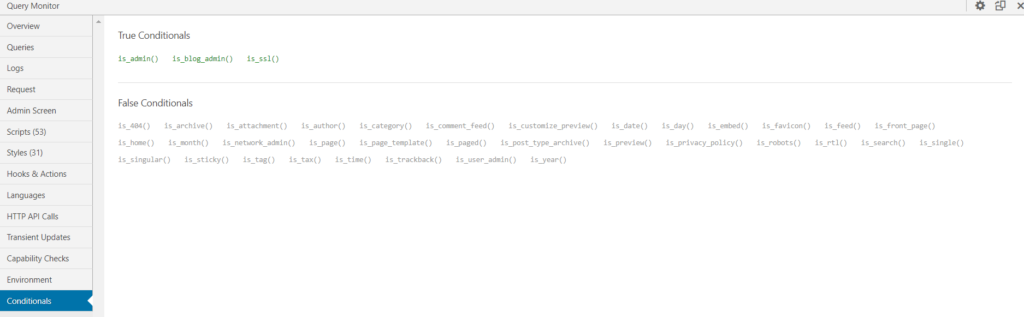
Conditionals
This tab allows you to examine which condition statements apply to the current page, which is useful for custom development.
There are both “True” and “False” conditionals.
What are some advantages of using Query Monitor?
Some of the features of Query Monitor are listed below
- Database queries, AJAX calls, REST API requests, and redirection can all be monitored.
- Determine which WordPress components are responsible for each request.
- Examine how long each request takes to process and what data it retrieves.
- Notifications about delayed requests, duplicate queries, and other forms of problems are sent to you.
Conclusion
It is essential for WordPress websites to have their own databases, which means they must also process queries. Keeping a close eye on those queries is an excellent way to troubleshoot issues and discover what plugins and themes are doing behind the scenes. The more complex your site is, the more queries it will need to handle.
It is important to keep an eye out for duplicate queries, to avoid compatibility issues. The results can be broken down by component as well. In this way, you can track the number of queries made by plugins and themes and when they take longer than expected.