
You hit refresh. The page spins. Nothing happens, and suddenly your server logs are full of 499 error codes. What just happened? This mysterious HTTP status code is something we dive into quite a lot and makes developers pull their hair, specifically with NGINX, Amazon Web Services, and when you have some proxy setups.
Unlike 502 or 504 server errors, we are all familiar with, the 499 HTTP status code is not officially defined in the HTTP standard. However, it is an integral part of the current web apps, cloud platforms, and API gateways. Most frequently observed on NGINX, this code indicates the client closed the connection before the server could respond—a silent interruption that can impact the performance and user experience of your website.
Here, in this post, we will delve into the 499 HTTP error, how it differs from 502 and 504 errors, root causes in the AWS environment, and how to troubleshoot and resolve the same from inside the NGINX logs.
Let’s decode 499 error code!
What is The 499 Error Code?
The 499 status error code is dedicated to NGINX and used to indicate that a client has closed the connection. It indicates that on the server side, the connection is being forcibly shut down by something unexpected, usually by the client (browser or app). It is not considered a part of the official HTTP standard but is commonly used in proxy servers (like NGINX).
Why it matters
It may seem benign, but error code 499 can also signal timeouts, slow responses from the backend, or frontend errors. Keeping track of it becomes key as the performance is influenced, and it leads to a reduction in failed requests in high-traffic systems.
What Are the Root Causes of a 499 Error?
The average root cause of an HTTP error code 499 is that a user or client aborts the request unexpectedly, for example, the user clicks away, closes the access document, or the internet connection breaks. If the tasks take a long time for the backend to process or it’s frozen, it returns 499.
Key Triggers
- The user navigates away before the response
- Slow upstream API responses
- Mobile network disconnections
- Timeout misconfigurations in NGINX
- Large file uploads or downloads
Differentiation of 499 504 502 Error Codes NGINX AWS
502 and 504 are both server errors, while 499 means the client is disconnecting before the server completes its response.
Comparison Table
| Error Code | Source | Meaning | Common Cause |
|---|---|---|---|
| 499 | Client (via NGINX) | Client closed request prematurely | User navigates away or network timeout |
| 502 | Server | Bad gateway / invalid upstream response | Server crash or backend failure |
| 504 | Server | Gateway timeout | Backend took too long to respond |
How Does 499 Appear in AWS and NGINX Logs?
In NGINX logs, a 499 error is shown as status=499, often with a low byte size. In AWS setups using NGINX, these can indicate networking issues, load balancer timeouts, or slow Lambda/API responses dropped by the client.
Sample Log:
10.0.0.1 - - [04/Jun/2024:14:32:55] "GET /api/user" 499 0 "-" "Mozilla/5.0"
How Do You Fix or Reduce 499 Errors?
You reduce error code 499 by optimizing server performance, reducing backend latency, and tuning NGINX and load balancer timeouts. Also, consider enabling retries in clients and reviewing long-running endpoints.
Best Practices
- Optimize backend database queries
- Use caching where applicable
- Avoid blocking operations in APIs
- Ensure the client doesn’t timeout before the server
NGINX Configuration Example
location /api/ {
    proxy_pass http://backend;
    proxy_read_timeout 60s;
    proxy_connect_timeout 10s;
}
How Does Error Code 499 Affect UX and SEO?
Even if 499 errors don’t impact SEO in a direct sense (bots might not be able to provoke them), it can affect UX as it leads to slow page loading or silent failure. High 499 rates could be an indicator of architectural problems in relation to conversions and bounce rate.
CyberPanel Role in Monitoring 499, 502, and 504 Errors
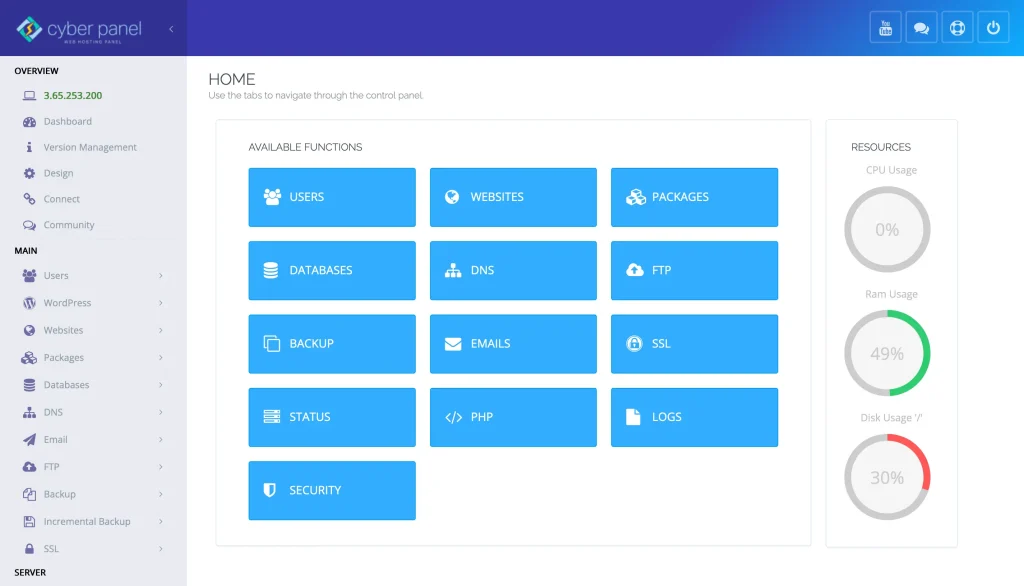
CyberPanel, a robust web hosting control panel, helps by:
- Enabling access to real-time logs
- Offering LiteSpeed server analytics
- Configuring ModSecurity for controlling requests from the client
- Sharing access logs to track down 499, 502, and 504 error patterns
- Allowing you to configure NGINX or OpenLiteSpeed timeout settings
You can access logs directly from the dashboard and debug problems from the client side or the server side, without switching tools. It really is a powerhouse panel for modern web performance debugging.
FAQs
Is 499 an error status code for the server or a client?
It’s a client error. The client closed the connection before the server sent a response.

How to live monitor 499 errors?
Leverage tools such as Datadog, ELK Stack, or the log viewer included with CyberPanel.
Are 499 errors dangerous?
Not always. Some are fine, but repeated 499s may be a sign that the backend is taking too long to respond.
Do search engines even see 499 errors?
Rarely. Most bots wait for your server responses or retry anyway, so 499 is rarely affecting SEO.
Can I simulate a 499 error?
Yes. Begin a long API call and then close the browser tab halfway through the request.
Culmination!
Error code 499 might not cause your system to crash, but it can silently degrade your performance and user confidence. Whether you’re running NGINX in combination with AWS or a local server with CyberPanel, being aware of these client disconnects is important.
Actively monitor, optimize judiciously, and keep your backend snappy. That’s how you fight the silent disrupter — HTTP 499.
Take Control of Your Server Health — Eliminate 499s Before They Cost You!