Kubernetes is already a world-changer regarding the orchestration of containers and makes it pretty simple to deploy, scale, and manage containerized applications. However, Kubernetes, requires specific tools and strategies to do things effectively, securely, and within your budget. We will go through some essentials in Kubernetes monitoring, best practices, tools, and how CyberPanel can optimize your setup.
What is Kubernetes Monitoring?
Kubernetes monitoring refers to the activity of observation and collection of performance metrics from Kubernetes clusters. This implies tracking a lot of aspects such as nodes, pods, and generally the infrastructure, so that this system functions at its ideal level, with no bottlenecks whatsoever. Good monitoring also makes light of some resource usage, application health, and security problems.
Why is Kubernetes Monitoring Significant?
Monitoring is a big part of managing Kubernetes. Here is why:
- Optimization of resource distribution saves money and improves efficiency.
- Fast issue detection eradicates downtime.
- Monitoring alerts you to fast-detection security threats.
- Monitoring is important for resource utilization and cost management.
Kubernetes Monitoring Tools
The challenges in monitoring Kubernetes clusters when proper tools are not availed.
Prometheus
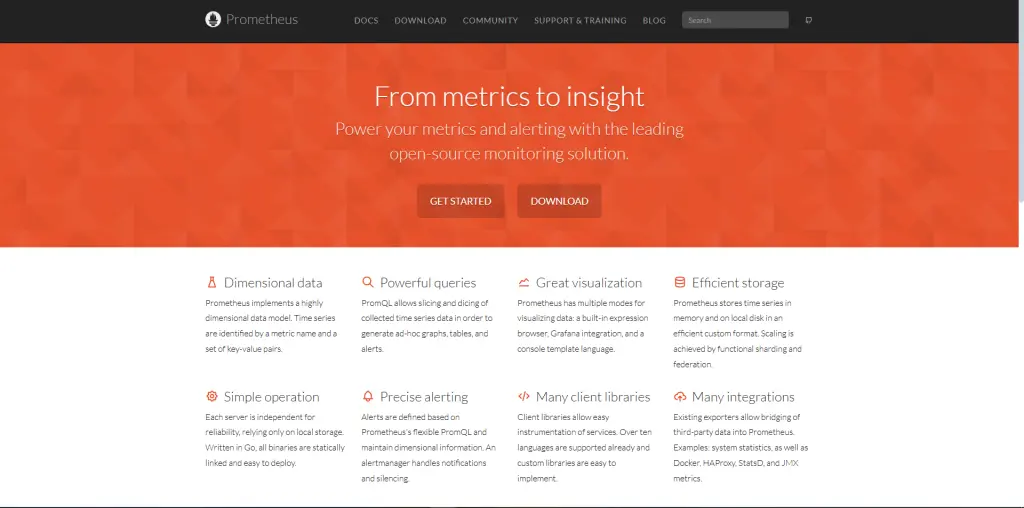
Overview: Prometheus is a high-performance open-source monitoring and alerting toolkit, especially for cloud-native architecture. As one of the top-used monitoring tools for Kubernetes, Prometheus has proven very reliable in dealing with such massive amounts of data.
Data Collection: It runs a pull model that checks targets like application services in the system to scrape relevant metrics at defined intervals in time. Thus, such real-time data is assuredly always ready for assessment.
Get exclusive access to all things tech-savvy, and be the first to receive
the latest updates directly in your inbox.
Powerful Query Language: It comes with PromQL, an extensible query language that helps you analyze and visualize your data deeply. This tool is very useful for digging into metric details.
Alerting and Integration: Prometheus has alerting support in the form of Alertmanager. The alerts are configurable and can be directed to email, Slack, or PagerDuty channels.
Scalability: Prometheus scales very well, taking data from thousands of nodes. Remote storage integrations help store data for long-term analysis.
Vast Ecosystem: The Prometheus ecosystem contains exporters that allow monitoring of almost any metric, from database performance to application-specific data.
Code Example:

Pros of Prometheus: It has high adoption in the Kubernetes environment and is extensible with third-party exporters to suit customized monitoring needs.
Grafana
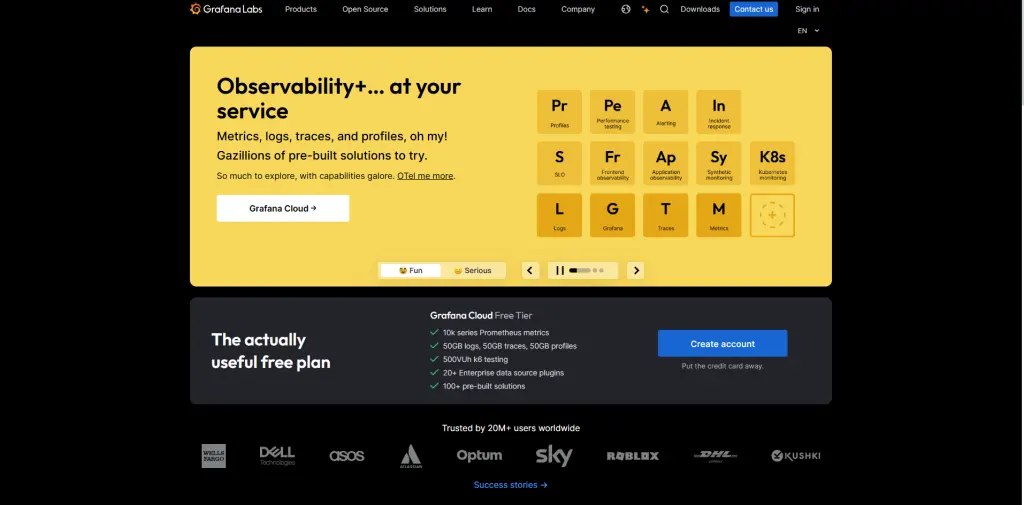
Overview: Grafana is a multi-platform open-source analytics and interactive visualization software. It’s usually used side by side with Prometheus to present detailed graphical representations of metrics.
Custom Dashboards: This feature allows you to create your customizable dashboards with data coming from various sources, thus providing you with an all-around view of your cluster performance.
Data Sources: Multiple data sources like Prometheus, Elasticsearch, and AWS CloudWatch are supported. It is highly versatile.
Alerting Features: Advanced alerting mechanisms are built into the Grafana for setting up and receiving alerts based on thresholds defined in visualized metrics.

Ease of Use: The interface makes it pretty easy to navigate, whether you’re a beginner or someone who is familiar with monitoring Kubernetes. Templates offer pre-configured setups; they are relatively easier designs for dashboards.

Output: Access your dashboards over http://localhost:3000 and view the metrics for your clusters.
Data Visualize: Grafana has graphs, heat maps, and map visuals that help in explaining complicated information with a rather easier approach towards the follow-up of trends.
Security: It provides advanced authentication and authorization, such as role-based access control (RBAC), to ensure data security.
Extensibility: Grafana supports extensibility through plugins, which can be used to add new visualization types or data sources.
Datadog
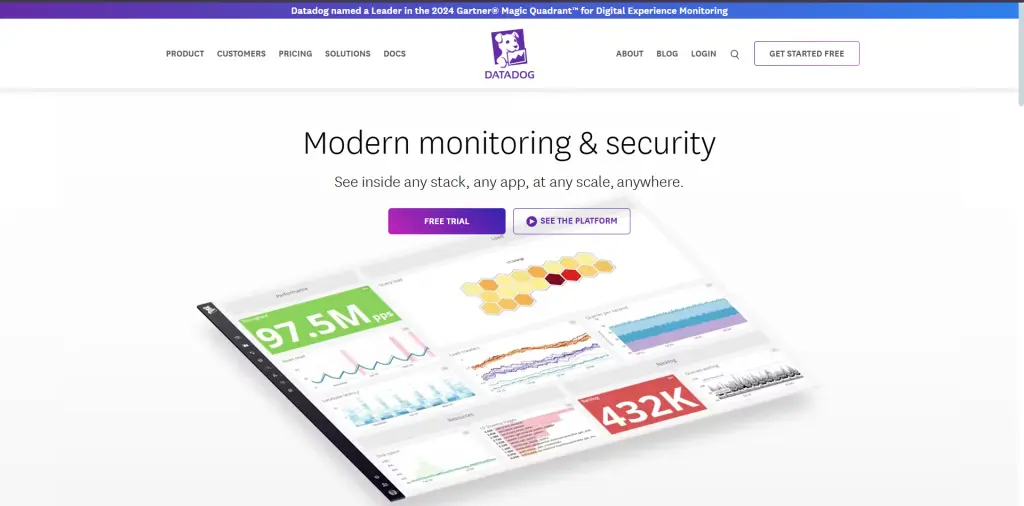
Overview: Datadog is an end-to-end monitoring and security product. It offers visibility and insights into all of the Kubernetes environments created by one. The feature ranges from performance monitoring to anomaly detection.
Kubernetes Integration: Datadog discovers automatically when there are any new additions of containers that will further monitor their performance and immediately alert them in case of issues. These metrics it collects from Kubernetes API and Kubelet as well as from the application in use.
Real-Time Monitoring: Datadog live view of containers: this option provides real-time information on everything running in your container such as CPU, memory utilization, and even network.
Auto-Scaling Insights: It monitors the influence of scaling operations on application performance to optimize for both cost and performance.
Log Management: Datadog’s log management platform collates and analyzes logs coming from all Kubernetes services, thus it is easier to track any issues.
Security Monitoring: Datadog provides security monitoring for Kubernetes and allows you to identify privileges escalation and other anomalous activity in containers.
Code:

Output: Datadog starts collecting metrics and logs from your Kubernetes cluster.
Cost Monitoring: Datadog provides in-depth reporting on resource utilization to enable effective resource allocation for cost optimization.
Kubernetes Dashboard
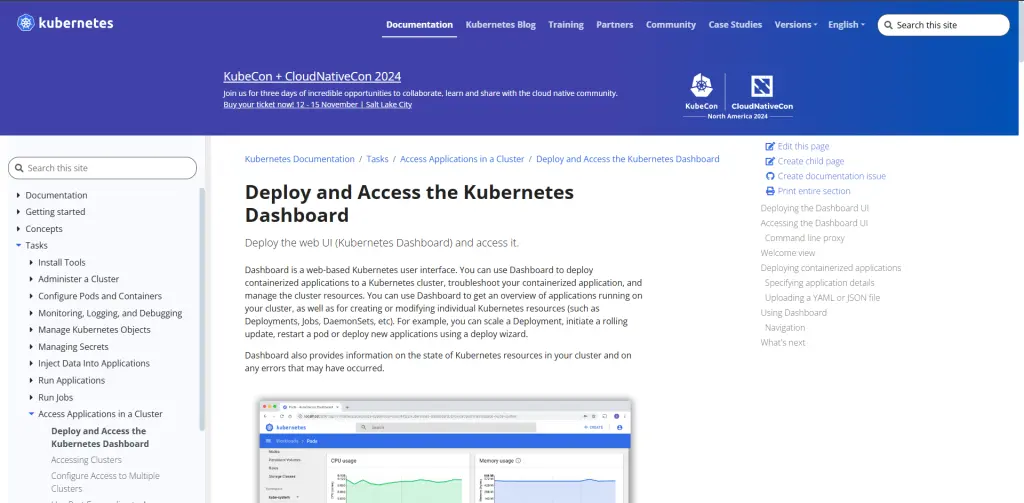
A web-based UI for Kubernetes that allows you to manage your applications and monitor the health of your cluster. It’s really helpful in visualizing active workloads and resource utilization.
User-friendly interface: This dashboard makes it easy to view and manage resources like pods, deployments, and services.
Quick debugging: You can check error logs, debug issues, and update container images from within the interface.
Live metrics: The user interface provides you with the actual data for resource consumption to let admins make the most out of performance.
RBAC: The dashboard meets all the security measures applied to Kubernetes and provides RBAC to ensure proper permissions
Use Cases: This tool is ideal for teams that need simple, unified means of Kubernetes monitoring, without added overhead when creating.
Weave Scope
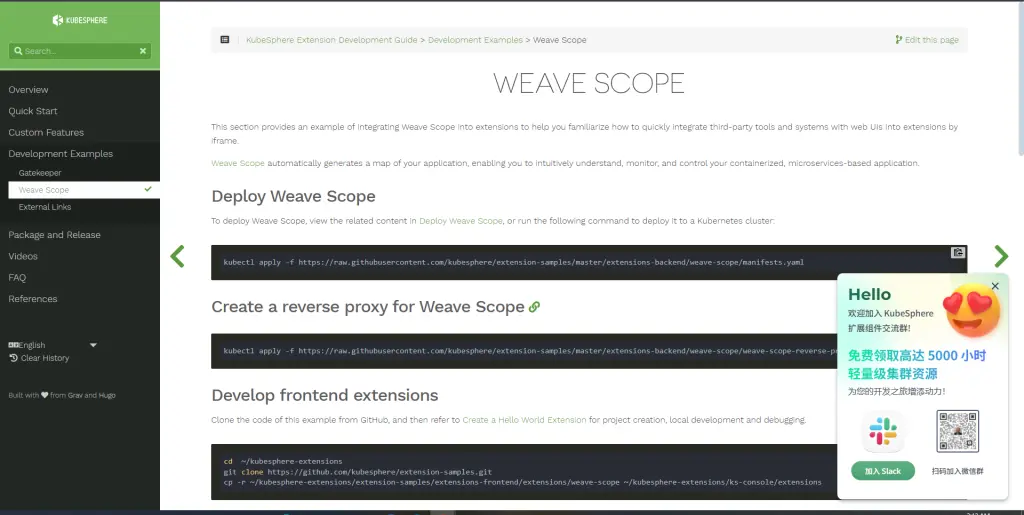
Description: Weave Scope is a visual and monitoring tool, built specifically for microservices and containerized environments. It gives you an interactive map of your infrastructure and how the containers and services interconnect.
Real-time Observability: See your processes, containers, and hosts in real-time, with high-lighted metrics like CPU and memory usage.
Intelligent Diagnostics: Gives diagnostics functionality to debug performance bottlenecks.
Automatic Discovery: It automatically maps your whole application, thus eliminating any need for manual configuration
Security Features: This does enforce network policies to create secure communication between containers.
Setup Code

Outcome: Deploys Weave Scope, enabling real-time monitoring and debugging.
Practical Use: Ideal for visualizing and troubleshooting complex, microservices-based architectures.
Kubernetes Metrics Monitoring
It is essential to know which metrics to monitor to optimize your Kubernetes cluster.
CPU and Memory Utilization: It is the way resources are made available for application access and consumption.
Pod and Node Health: Monitor the status and availability of all pods and nodes.
Network Traffic: Keep an eye on the incoming and outgoing network traffic.
Example of Metrics Query in Prometheus:

Result: CPU utilization over a five-minute interval. This will help determine if there are spikes in resource usage.
Kubernetes Cost Monitoring
This will save much on resources and avoid overspending. Here is how you can do this:
Kubecost
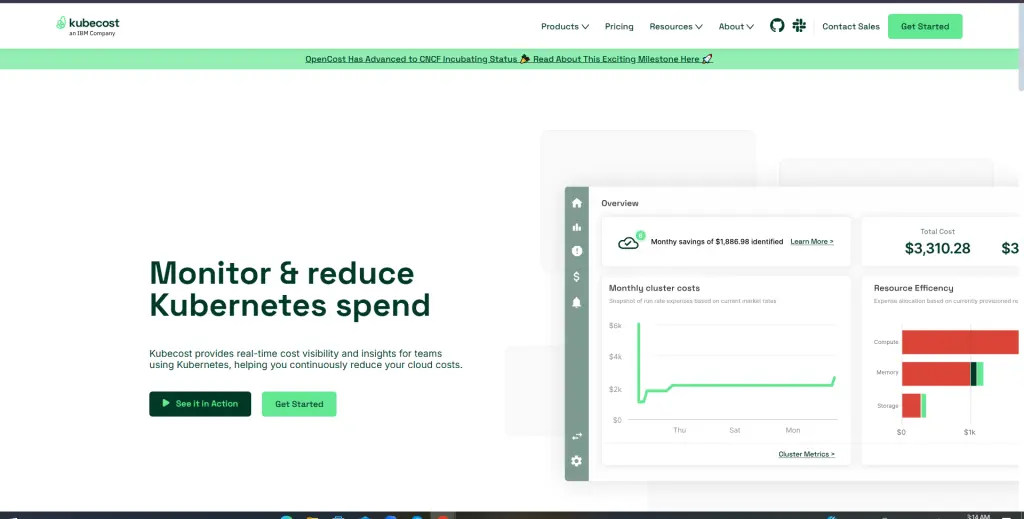
Overview: Kubecost offers very detailed visibility into how much you are spending on resources in Kubernetes. It tracks where you are generating costs and suggests ways to optimize resources.
Features: It utilizes namespace, deployment, or service/pod-based charge-back. It could synchronize fully with cloud billing API so that the same will have complete transparency concerning your costs.
Cost Optimizer: Kubecost does offer actionable recommendations so that the user can right-size some of the containers or make use of the available spot instances to avoid any form of wastage of money being made out.

Kubecost will be deployed and will provide resource consumption details with saving opportunities.
Scenario: For finance teams that need to have full, detailed cost breakdown to ensure effective budgeting.
Kubernetes Monitoring Best Practices
Multiple monitoring tools shall be used: Prometheus could be used for metric collection and Grafana for visualizing them so that maximum amounts of insight can be collected.
Set Regular Alerts: Create alerts specific to certain metrics to avoid the noise of getting all critical issues.
Review and Optimize periodically: Monitoring configurations need to be reviewed and optimized for better usage of the resources
Auto-scale according to the usage of resources: Continuous performance with cost reduction.
Security-first approach: Suspicious activities Security best practice: Channel communications are encrypted
Examples
1. Installation of Prometheus and Grafana using Helm

Output: The server is running and metrics will be collected from the Prometheus
2. Accessing Grafana Dashboard

Output:
Grafana is now available at http://localhost:3000.
Role of CyberPanel in Monitoring Kubernetes
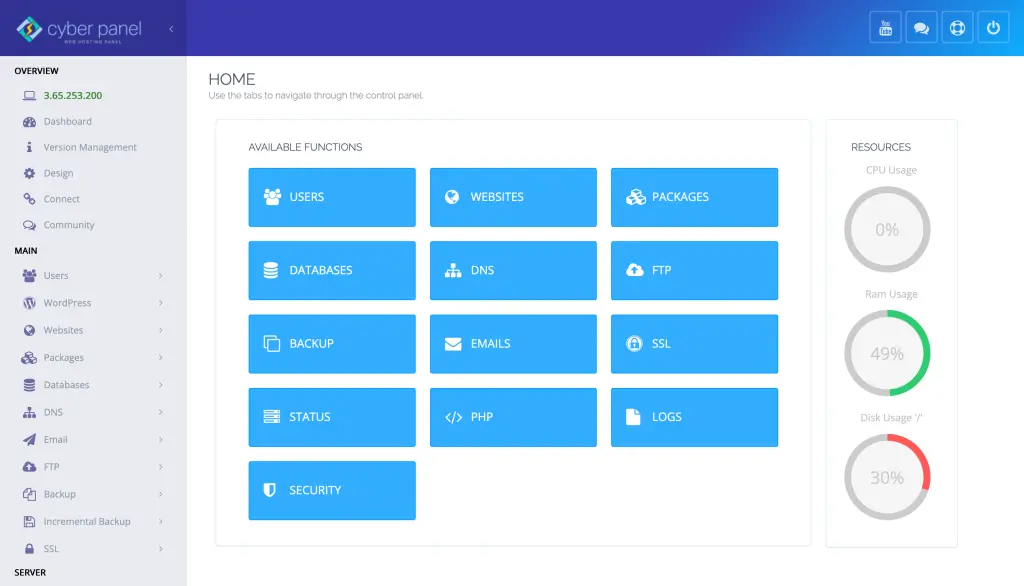
CyberPanel i.e. a popular open-source web hosting control panel assists in the monitoring and management of servers using Kubernetes through the following features:
Server Management: There is access to logs as well as performance metrics that one may need.
Resources Management: It helps allocate the use of server resources for proper management. CyberPanel incorporates security options on it which makes the operation of handling Kubernetes nodes highly secure.
User-Friendly Interface: It applies to those who want to establish servers that work side-by-side with Kubernetes.
FAQs on Kubernetes Monitoring
1. Which are the best Kubernetes monitoring tools?
The best are Prometheus, Grafana, Datadog, and Kubernetes Dashboard.
2. How can I monitor costs in Kubernetes?
Use Kubecost for analyzing and managing resource expenditure.
3. Why is Kubernetes monitoring important?
It ensures the health, security, and cost-effectiveness of your clusters.
4. How can I configure an alert in Kubernetes?
Configure critical alerts through Prometheus Alertmanager.
5. Do I need just Prometheus to monitor?
Of course, even though Prometheus is an incredible tool, pairing with Grafana enhances the visualization capabilities of data.
6. Which are some metrics I need to watch in Kubernetes?
Essential ones include CPU, Memory utilization, pod health check, and network utilization.
Conclusion: Master Class in Kubernetes Monitoring
To sum up, monitoring is therefore really important in maintaining uptime, resource utilization optimization, and cost control in the company. Equipped with a tool such as Prometheus which can help one generate lots of metrics and possibly set up a system that collects these metrics; for easy visualization, there’s Grafana and then also at a deeper insight point in Datadog. Kubernetes clusters will remain efficient while running through the implementation of best practices. Automation practices, such as setting setup targeted alerts in a running Kubernetes cluster, help improve the infrastructure resilience while allowing it to stay very effective.
CyberPanel makes the process easier by making deployment and integration of these tools simpler, thus easily monitoring and managing your environment.
Ready to Boost Your Kubernetes Monitoring? Start optimizing with CyberPanel today and unlock the full potential of your Kubernetes clusters for a robust, future-ready setup!
