
Strace Linux is a debugging and instructional userspace utility for Linux. Allows users to watch and trace system calls, and signals a process receives. Strace Linux is a useful utility for tracing system calls used by applications and understanding their usage of the operating systems from both security penetration testing perspectives. These system calls are the primary way that programs interact with the kernel, making Strace an excellent tool for understanding program behavior and diagnosing system-level issues.
In this post, we will cover when and how to use Strace Linux with detailed examples and also together with CyberPanel can assist in managing the server as well as debugging.
Let’s dive deeply!
Why Use Strace?
- Debugging: Locate system call errors.
- Performance Tuning Detection of Bottlenecks in System Call Handling.
- Security Audits (ie: What the system calls a process that indicates malicious activity)
- Learning: show how an app should behaveDocumentation: Demonstrate the behavior of apps
Installing Strace on Linux
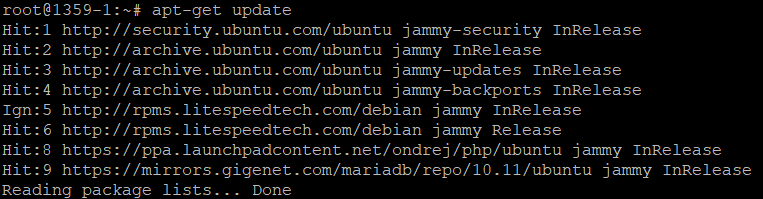
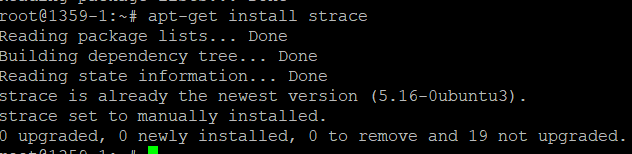
Strace Linux is one of those tools that ships with default repositories in most Linux distros The installation steps are slightly different because of the package manager that comes with each Linux distro.
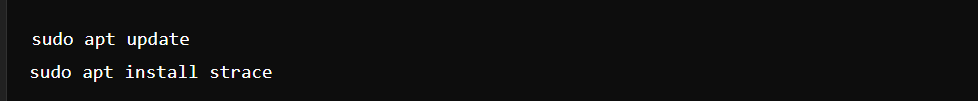
For Debian/Ubuntu-based systems:
For Red Hat/CentOS-based systems:

For Fedora:

For Arch Linux:

Basic Usage of Strace Linux
After installing Strace Linux, you can start using it to trace system calls. The most common usage is to run Strace with a specific command. This command will trace the execution of the specified program.
Example: Tracing a Simple Command

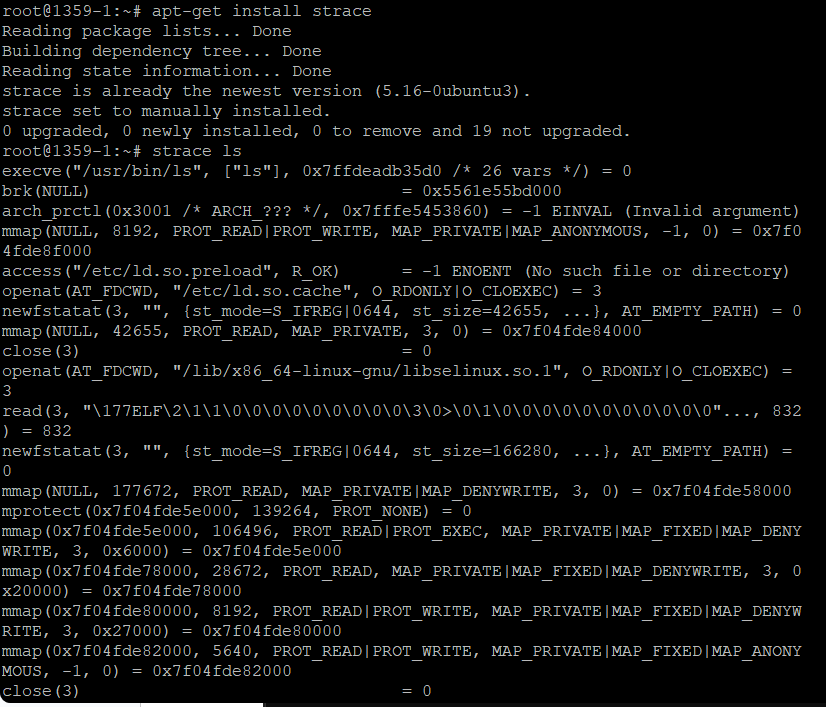
This command will display all the system calls made by the ls command as it runs. Output includes calls to open, read, write, close, and other system calls.
Saving Output to a File
You can save the output of strace to a file for further analysis:
The -o option directs strace to write the output to a specified file (trace_output.txt in this case).
Tracing a Program with Arguments
If you want to trace a program with specific arguments, you can include them after the command:

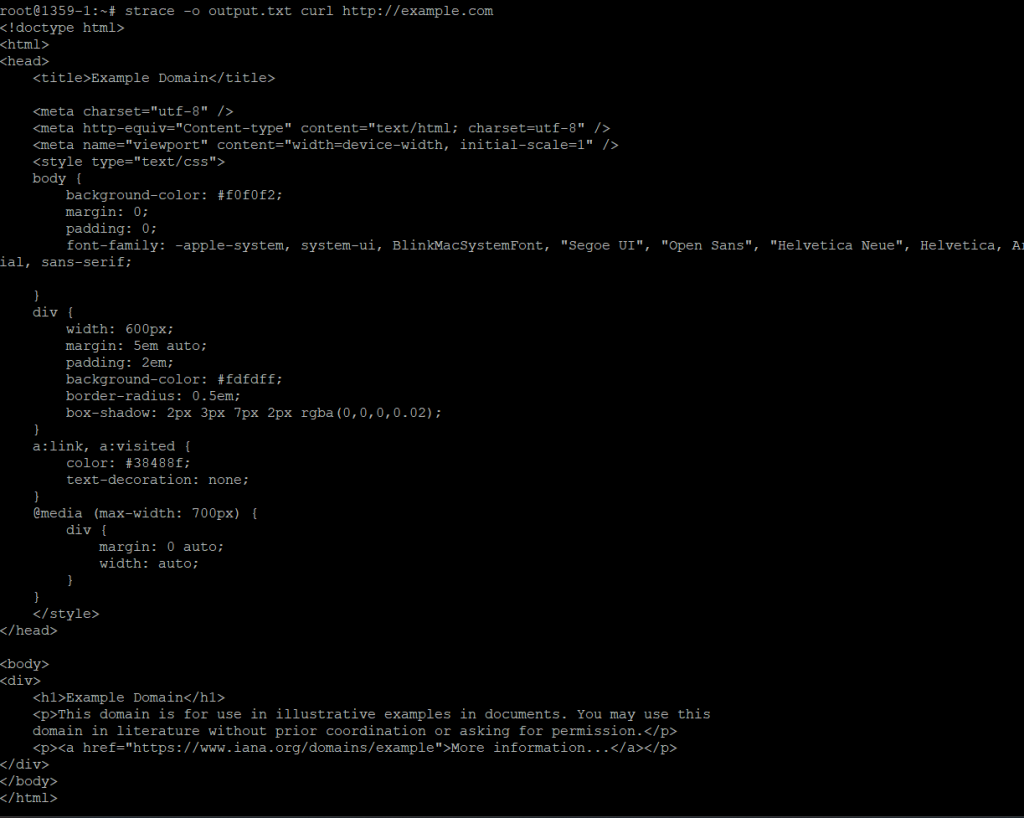
This traces the curl command with the argument of a specific URL.
Strace How To Guides & Examples For Linux
It provides several options that enable users to filter and format strace output.
Tracing System Calls of already running process
The system calls of a running process can be traced using the -p option followed by its PID.

This will provide a summary showing the number of times each system call was made, the total time spent on each call, and other statistics.
Replace <PID> with the actual process ID of the running process.
Filtering System Calls
To only trace specific system calls, use the -e option:


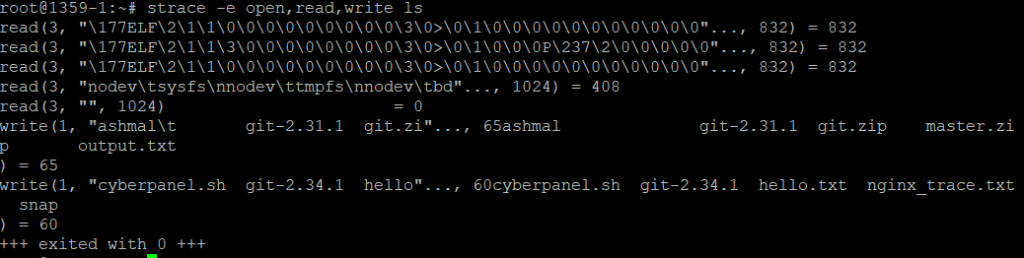
This command will only trace open, read, and write system calls made by the ls command.
Counting System Calls
To count how many times each system call is made, use the -c option:

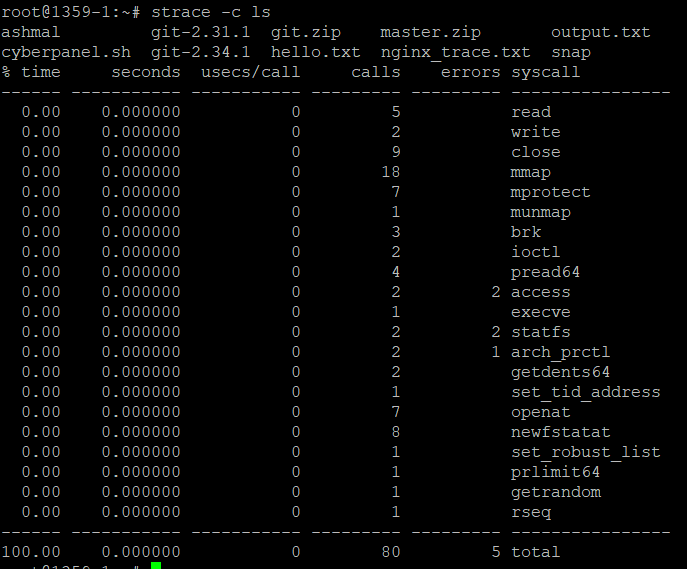
This will provide a summary showing the number of times each system call was made, the total time spent on each call, and other statistics.
Debugging with Strace
A great use case of strace is in troubleshooting problems that are related to system calls. For example, tracking why a program cannot open a file or fails to connect with the network resource.
Eg: Fix File Access Issues – Debugging
What happens if a program is trying to open and read from a file, but fails to do so because of perhaps some permission problems or something? Let’s examine the specific system that calls for file access with strace.

The output will show every attempt to open a file, along with the file path and any errors returned (e.g., EACCES for permission denied).
Debugging Missing Libraries
If a program fails to start due to a missing library, strace can help identify the missing file:

This traces all open calls, showing which files are being looked for and where the failure occurs.
Monitoring Network Activity
strace can also be useful for tracing network system calls like connect, sendto, recvfrom, etc. It is extremely helpful when you are debugging network-related problems in applications.
Example: Network Calls Tracing

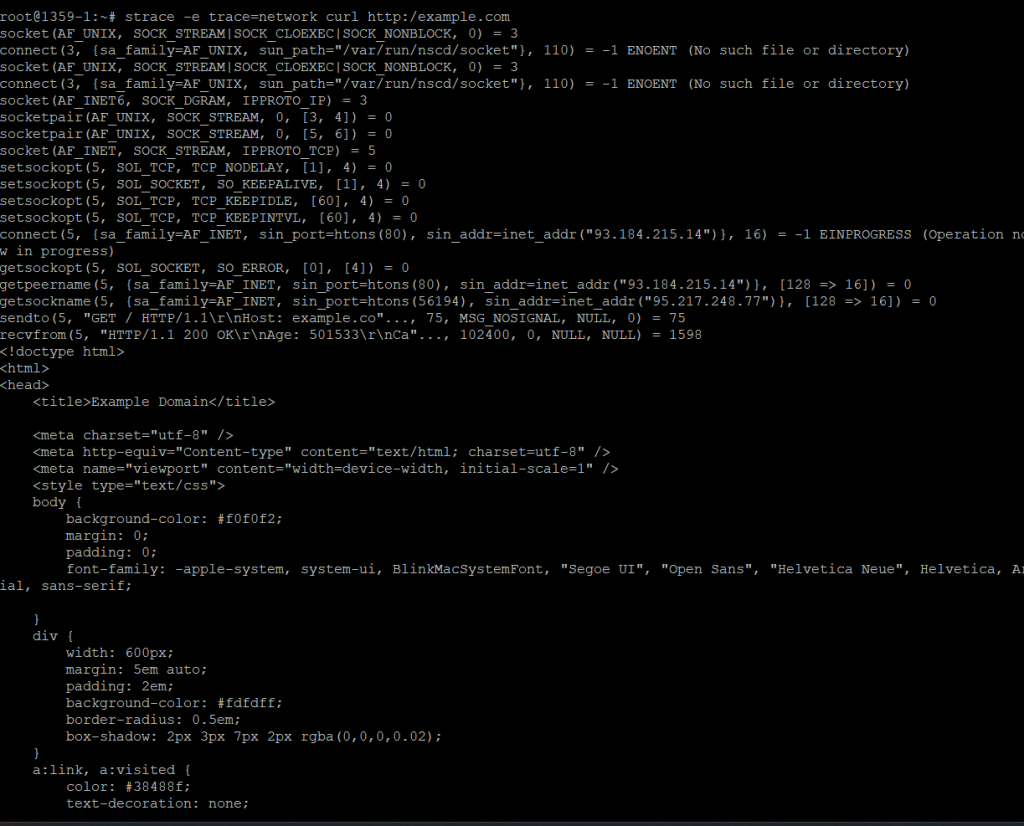
The above command will trace only the network-related system calls by curl while accessing the URL.
Example: Analyzing DNS Resolution
To see how an application resolves DNS queries, you can trace relevant system calls:

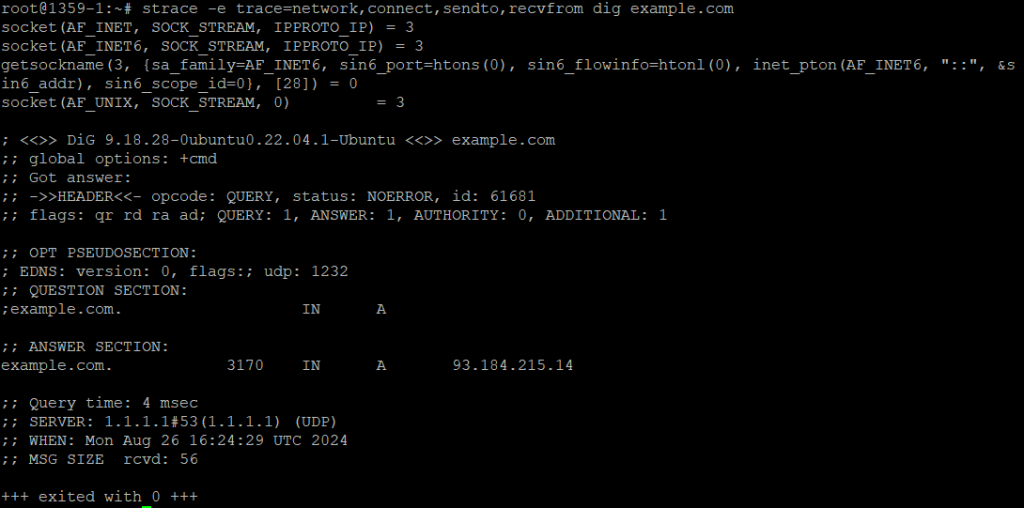
This traces the DNS resolution process, showing how the dig command communicates with DNS servers.
Strace for Performance Analysis
You can analyze performance by seeing which system calls take the most time with something like strace. This is handy for identifying bottlenecks in code.
Measuring Execution Time
With the -T option you can see the time for each system call:

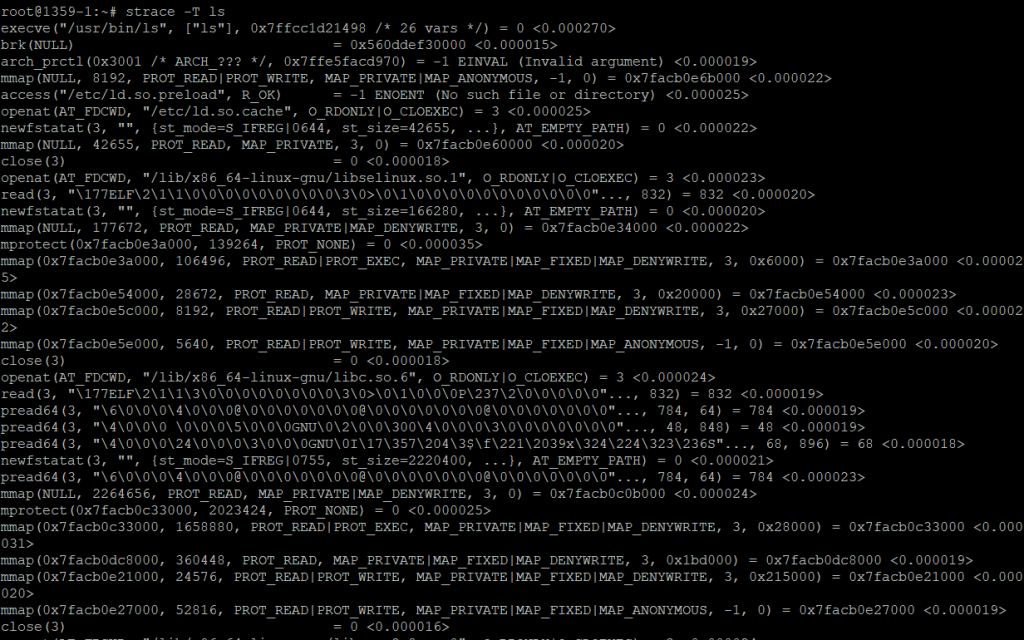
This will append timing information to each system call, showing where time is being spent.
Detailed Timing Analysis
If you want to dig a little deeper, add microsecond-level precision on timestamps:


This provides high-resolution timing information, useful for precise performance tuning.
Using Strace Linux with CyberPanel
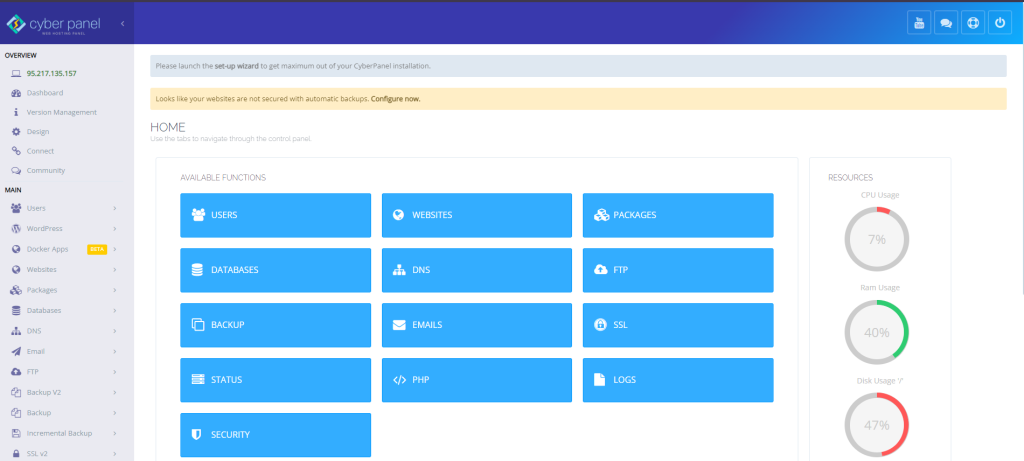
Among web servers, database interactions and custom scripts can benefit from strace a lot in the case of CyberPanel in the environment.
Example: Diagnosing Web server problems
If a website hosted on CyberPanel has issues, then you can trace the process of OpenLiteSpeed using Strace like this:
Find the PID of OpenLiteSpeed:

Trace OpenLiteSpeed Process:

Replace <PID> with the process ID of the OpenLiteSpeed server.
Security and Best Practices
Here are some strategies for enhancing the security of Strace Linux
- Access Control: Ensure that the Strace Linux is used by authorized personnel only as it can reveal sensitive data.
- Performance: Strace Linux slows down the traced process therefore, it should be used with care in production.
- Security Audits: Monitor unexpected system calls with Strace for better security and use it during your regular security audits.
Regular Use and Automation
Incorporate Strace Linux into scripts that run automatically for periodic monitoring. For instance, using cron jobs, you can track important processes and log system call activity for any unusual occurrences before the interval elapses.
FAQs
1. What is Strace in Linux?
Strace is a system call and signal tracing operation used to debug, maintain performance, and ensure better security on production.
2. How to install Strace on Linux?
Some distros can install Strace with package managers, using `apt` for Debian/Ubuntu: yum in Red Hat/CentOS or dnf on Fedora and Pacman to Arch Linux.
3. How is it to use Strace in a production environment?
It can slow down the process being traced, so it should be used cautiously in production, mainly by root (or equivalent) users for debugging and monitoring purposes.
4. Can I trace the already running process with Strace?
Strace can attach to an existing process by using PID with the -p option and trace its system calls in real time.
Conclusion
One of the things enjoyed in Linux system called auditing tool is strace. Strace Linux tries to give you those deep insights into what a program does: system calls. With the help of server management tools like CyberPanel, administrators can use strace without any kind of hassle at all to diagnose their issues and optimize performance while maintaining a vigilant eye on security. Strace Linux for web environments in combination with features of CyberPanel makes sure that you have a secure and well-run environment.
Ready to optimize server performance with CyberPanel?