
In the turbocharged, constantly changing domain of web hosting, your server performance can make or break your online singleness. Just imagine if your site is suddenly down during peak hours — customers and revenue are right out the window, all due to something you missed in your server. This is where web server monitoring helps.
The monitoring of the web server is the basic practice that will help the administrators to keep the web server stable, efficient, and secure. Web server has to be monitored Web server monitoring — is when you look at the vital statistics of the web server, from the server load to server resources usage to spotting away a potential issue before it becomes a catastrophic failure. Proper web server monitoring ensures that your web server runs optimally at all times, whether you are maintaining a small personal website or a large-scale high-traffic e-commerce platform.
For enterprises with an Apache web server, the stakes are raised even further. In this post, we provide some background on Apache servers, their monitoring requirements, and some specific app developer use cases.
Functions Related to Web Server Monitoring
Webbased server monitoring is the lifeblood of keeping your webserver secure and in peak performance. When we build web pages, we do build the front-end user request and the web server (such as Apache) processes and deliver the page to users but all of these resources would take a lot of time to do. Unmonitored issues, such as slow response times, memory leaks, or overloaded servers, can remain undetected for some time, which may lead to slow performance or even downtime.
Checking your web server regularly allows you to understand performance issues before they become problems. With Apache web server monitoring, this ensures that the respective parameters that can change Apache’s behavior—CPU load, usage of memory, disk I/O, and network traffic, in particular—are monitored to ensure optimum performance.
The Importance of Apache Web Server Monitoring
Apache, as one of the most common web servers around, can claim its popularity for being flexible, secure, and free and open-source software. While this is one reason why Apache may be a popular choice for a web host, it’s also another reason why it falls on administrators to regularly check on its performance. Why monitor Apache web servers? Monitoring of Apache web servers is very useful because:
- Ensure uptime: By monitoring server performance and traffic spikes, administrators can stop server failures from creating outages.
- Optimize resource allocation: By monitoring Apache, you can optimize resource allocation to prevent server overload and ensure faster response times.
- Identify security threats: Apache logs and performance data can help monitor for abnormal traffic patterns to help detect and mitigate security threats such as DDoS ( Distributed Denial of Service) attacks or malware.
Monitoring the Apache web server can help you reduce server downtime and keep your server performing at its best all the time.
Apache Web Server Monitoring Tools and Software
Apache is widely used currently, and monitoring its status can be tricky, but there are simple tools to get the desired figures. These tools monitor important metrics, alert you, and give you insights on areas that need attention. A number of popular and efficient tools are available for monitoring Apache web servers:
Nagios:

A Well-Known Monitoring Solution Nagios is a powerful and flexible open-source monitoring solution that can keep track of your infrastructure (e.g., Apache web servers). Nagios creates in-depth reports of server performance, status checks in real-time, and the ability to ping out alerts when thresholds are crossed. This is a sort of mission control and is equipped with plugins and checks that you can tailor to your craft.
Zabbix:
A Complete Monitoring System Zabbix is another very good monitoring tool that provides real-time data collection, reporting , and alerting. Its features include support for Apache web server monitoring, and it provides detailed insights into system performance, including server CPU, memory, and disk utilization. Zabbix is capable of handling extensive monitoring requirements and enables users to create sophisticated triggers and thresholds.
Datadog:

Cloud-based Monitoring for Web Servers Datadog is a cloud-based monitoring solution that works well with Apache servers, offering a holistic view of performance metrics across your application in addition to system health and infrastructure. And it lets you monitor metrics like response times, traffic volumes, and errors between each part of your stack. Advanced analytics are also provided by Datadog to access issue analysis and issue correlation.
Apache Status Module:
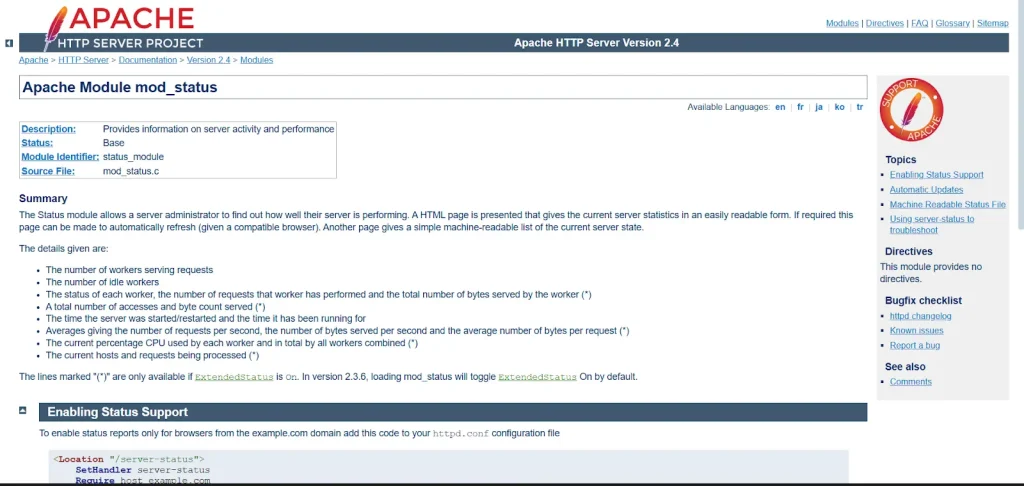
Core Apache Monitoring The Apache Status module is a lightweight built-in feature of the Apache web server. It provides live statistics including availability, active connections, and traffic load among others. It doesn’t have the deep feature set of other tools, such as Zabbix or Datadog, but it can serve as a fairly good starting point for people managing smaller sites or those with simpler needs.

Monitis:
Easy Monitoring Monitis is a cloud monitoring service that allows you to monitor Apache servers, web applications, and databases. Its powerful reporting and customizable alerts provide insight into real-time performance metrics such as uptime, response time, and bandwidth usage. Monitis is best for businesses looking for an all-in-one monitoring solution.
Metrics for Web Server Monitoring
There are few specific metrics that are crucial metrics to monitor for your server.
You can get the important metrics that are directly related to the performance and user experience while monitoring your Apache webserver. These include:
- CPU Usage: Excessive CPU usage can result in slow response time or crashes of the application server. Monitoring CPU Utilization to See Whether the Server can Handle Requests
- Memory Consumed: Apache has to use several components as threads to serve incoming requests. An unexpected spike in the usage of memory may be a sign of a memory leak or overconsumption of resources.
- Disk Space: Having little disk space can cause server errors and mess up data. Monitoring your server’s disk space is vital, more so if your server stores large files or logs.
- Network Traffic: Excessive amount of network traffic leads to bottlenecks or DDoS Support. Bandwidth usage tracking helps avoid congestion and optimizes data flow.
- Error Logs: Apache error logs provide information on possible misconfigurations, unsuccessful requests, or application errors. Routine examination of these logs can assist in identifying areas for optimization.
Regular monitoring of these metrics will help you ensure the Apache web server is always at its best.
How CyberPanel Can Help with Your Apache Web Server Monitoring
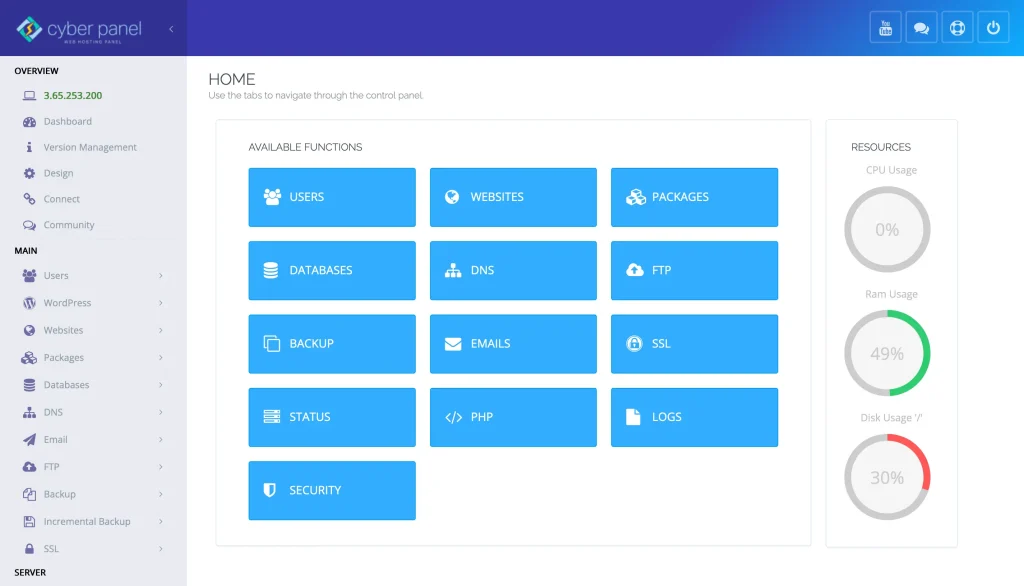
CyberPanel is a user-friendly web hosting control panel that makes server management easier. CyberPanel provides a smooth experience for monitoring Apache web servers. Here are some of its highlights:
- Real-Time Performance Monitoring: CyberPanel has a simple dashboard that shows various server statistics such as CPU, memory, and disk usage in real time.
- Handling Apache logs: CyberPanel provides you direct access to Apache logs and managing the logs becomes quite simple to identify and debug errors in minutes.
- Resource Utilization Perfection: Automatic scaling and resource optimization allow you to configure your Apache web server to use the right amount of resources, which will pay off in performance during peak times.
Ideally, using CyberPanel with other traditional Apache web server monitoring tools can greatly ease management and enable you to focus less on administrative tasks and more on growing your website.
FAQs About Web Server Monitoring
1. What is web server monitoring?
Web server monitoring refers to monitoring and analyzing various metrics of server performance, such as CPU usage, memory usage, and network traffic. It is to allow the server to function properly and remain secure.
2. Why do I need to monitor Apache web servers?
Monitoring tools allow you to optimize performance, maintain uptime, and detect any security issues early. This means that administrators can diagnose and mitigate issues before they affect users.
3. How do I make my server run better?
Reduce overhead by tracking key metrics such as CPU, memory, and disk space. Optimize resource allocation with tools like CyberPanel and regularly check Apache error logs for issues.
Final Thoughts!
It is important to have stable and adequate web server monitoring for the long-run of your website. Monitoring the performance of your Apache web server in general, you’d be looking at monitoring tools like Nagios, Zabbix, and Datadog, to monitor the performance and identify and resolve errors before they impact your visitors. By using CyberPanel you go one step further as it provides you with useful statistics about server health and performance from the UI.
So don’t wait for performance problems to become apparent — begin to monitor web server now and ensure your server runs well for your users and search engines.