

Ever wonder how to keep track of all network connections your Linux server handles? Do you find it cumbersome to diagnose network-related problems on your system? There is no better tool to understand, analyze, and solve network activity than netstat in Linux. This powerful command provides detailed information about active network connections, routing tables, and other important network statistics.
While some newer tools like ss have taken the place of netstat in Linux systems, it is still the perfect tool for simple debugging and monitoring, especially when you need to monitor some older systems. Here we’ll tell you everything about netstat on Linux-what it is, how to use it, and how CyberPanel can be useful for you.
Let’s learn the netstat command in Linux together!
Installing the Netstat Command
Here is how to install the netstat command on different Linux distributions.
Installation Steps
On Ubuntu/Debian-based Systems:

On CentOS/RHEL-based Systems:

On Arch Linux:

Verifying Installation:
After installation, verify if netstat is installed:

Why Use the Netstat Command in Linux?
The netstat command in Linux offers insights into the network behavior of the system, thus it becomes a utility for a lot of tasks:
Active TCP/UDP Connections Monitoring
The netstat command traces all the current TCP and UDP connections along with their states. This helps track the current network activity going on.
Open Ports and Services Identification
By listing services and their listening ports, netstat manages security and resource allocation.

Netstat in Diagnosing Network Latency Issues
By discovering high-latency connections or excess retransmissions, netstat assists in diagnosing slow network performance.

Displaying System Routing Tables
The routing table shows which packets are being routed through the system. This helps in debugging misconfiguration.

Monitoring Multicast Group Memberships
Multicast groups are important for networking because they allow sending packets to multiple destinations efficiently. netstat displays active memberships.

15 Uses of the Netstat Command in Linux
The netstat command for Linux is a powerful tool for monitoring and viewing connections, ports, and interfaces. Here are 15 practical ways to apply this command with examples

1. List All Active Connections
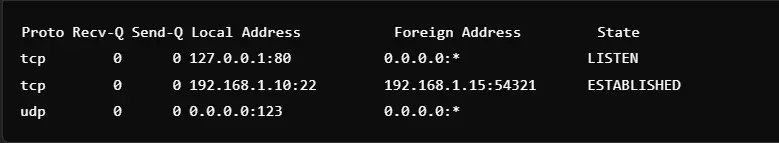
Command: netstat -a
This command displays all the active connections and listening ports on the system. It provides details of incoming and outgoing network traffic and information on both TCP and UDP protocols. This allows administrators to check for unauthorized connections in the system. The connection states in the output include LISTENING and ESTABLISHED. This is quite helpful for identifying open ports and active services.

2. Show only TCP connections
Command: netstat -t
This command will filter and show only the active TCP connections. This will be focusing only on Transmission Control Protocol, which is mainly used for reliable data transfer. This command will come in handy when monitoring secure connections like SSH or HTTP. Administrators will find this useful in debugging TCP-based applications. Output shows the state of every connection, such as ESTABLISHED or CLOSED.

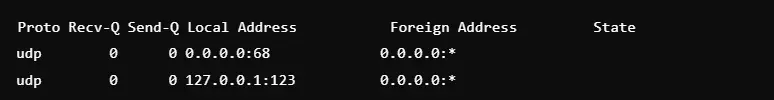
3. Filter UDP Connections
Command: netstat -u
It lists all active UDP connections and can be used for faster, connectionless data transfers like DNS or streaming. Since UDP doesn’t involve connection states like TCP, this command is apt for lightweight traffic monitoring. This helps in analyzing the problem with services that are relying on UDP, like VoIP or video calls. The output includes local and foreign addresses with active UDP ports.

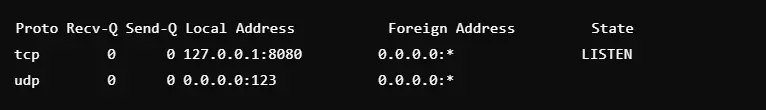
4. Listening Ports List
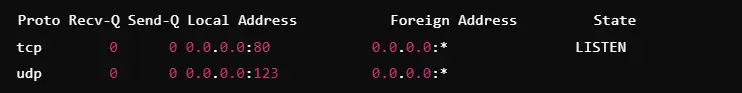
Command: netstat -l
This lists all ports that are in the listening state, awaiting incoming connections. It is used to see which services or applications are open to access from outside. This is very handy in security audits, ensuring there are no unwanted services open to the outside world. The output shows both TCP and UDP ports. Usually, administrators will use this to configure firewalls or debug connection problems.

5. Display Numeric IP Addresses and Ports
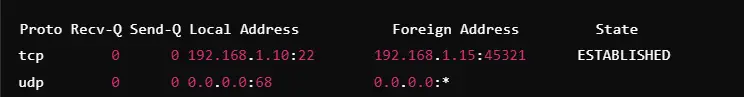
Command: netstat -n
This command bypasses DNS resolution and displays numeric IP addresses and port numbers. It is faster than the default output because it does not need to resolve hostnames. It is useful for rapid diagnosis and analysis of raw network traffic. It is also accurate because it eliminates potential DNS errors or delays. The numeric format is easier to match with configuration files and logs.

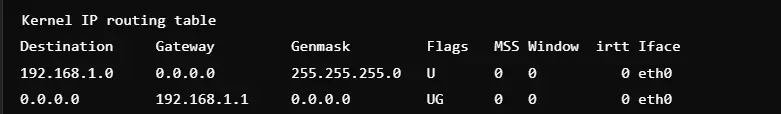
6. Show Kernel Routing Tables
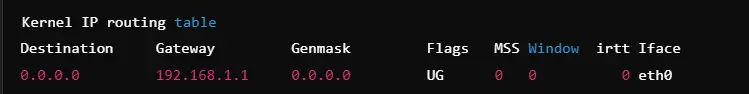
Command: netstat -r
This is a command that shows the kernel routing table, which indicates how data packets should be routed through the network. It lists the destinations, gateways, and subnet masks with their related interfaces. This is always useful in diagnosing or verifying routing problems or in checking network configurations. These are mostly used during networking setup or troubleshooting. The route command is similar to these commands; it gives metrics about routing.

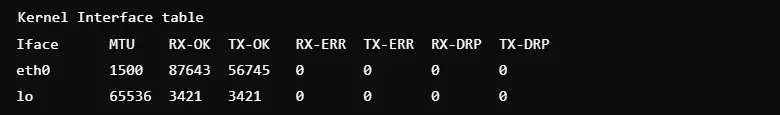
7. Print Network Interface Statistics
Command: netstat -i
This command shows an interface statistics summary. The number of packets received, transmitted, errors, and drops are shown. The command is useful in assessing network performance and can pinpoint hardware problems. It allows administrators to check the appropriate functioning of interfaces, for example, eth0 or wlan0. It’s often used in conjunction with other commands to optimize performance. It also shows the value of MTU and detailed information about interfaces.

8. Verify Process IDs Connected to Connections
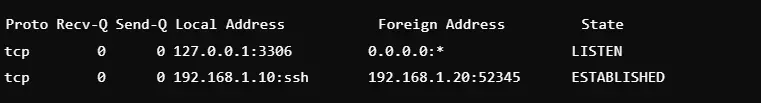
Command: netstat -p
This command associates each connection with its process ID and program name. It is helpful in tracking which applications are causing active network traffic. This will help administrators identify and stop suspicious or unwanted processes. It is very useful in securing servers or debugging problematic applications. The output contains local and foreign addresses and connection states.

Output:
Proto Recv-Q Send-Q Local Address           Foreign Address         State       PID/Program name

tcp        0      0 192.168.1.10:ssh       192.168.1.15:52345      ESTABLISHED 2135/sshd
9. Find Established Connections
Command: netstat | grep ESTABLISHED
This command filters and displays only established TCP connections and shows active sessions. This is an efficient way of checking current communication happening between the server and the clients. It is also good for checking secure connections like SSH or HTTPS. It will help an administrator determine whether an IP is acting suspiciously or if traffic flow is expected.


It is also good at displaying the active client IPs and the services used.
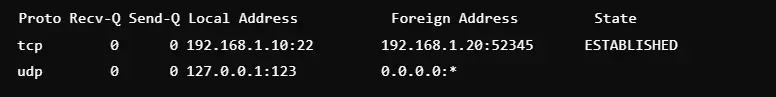
10. Suspected IP Activity
Command: netstat -a | grep [IP Address]
It scans for the connections relating to a specific IP address. It is helpful for tracking dubious activities or ensuring the authenticity of the connections. Administrators apply it to determine the occurrence of unauthorized access within an instance. It offers details, such as protocol, port, and connection state. It is a powerful tool for analyzing network security.
![Command: netstat -a | grep [IP Address]](https://cyberpanel.net/wp-content/uploads/2024/12/AD_4nXdn1rh7-wqW4nJqVbJfo4GYPXLW.webp)

11. Check Dropped Packets on Interfaces
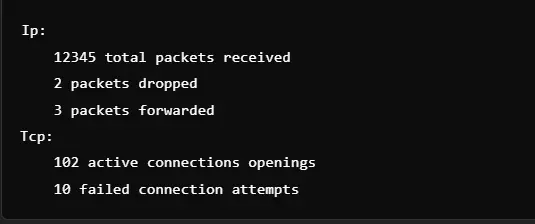
Command: netstat -s | grep “dropped”
This command will print statistics about dropped packets that might indicate network congestion or hardware problems. It’s an important command to trace performance bottlenecks in the system. Dropping packets may result in loss of data or degradation in application performance. This is the command administrators use to make adjustments to network configurations. It reports on packet loss on both received and transmitted sides.


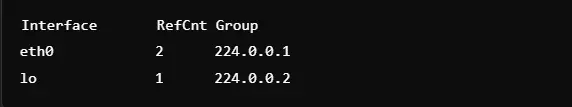
12. Multicast Group Memberships
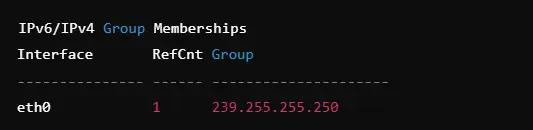
netstat -g
The command gives all the groups with which the system belongs and can be used efficiently while sharing data to large receiver numbers. The line says, “group Addresses followed by associated interfaces”; basically it’s helpful during a multicast debugging of real-time streams or feeds from and into a server to solve problems related to network grouping issues.

13. Bandwidth Consumption on The Server Level
Command: netstat -e
This command shows extensive packet and byte counts for all network interfaces. It will help administrators monitor bandwidth utilization and detect potential issues in the form of overutilization or misuse. This command is useful in monitoring data flow on critical interfaces. It also has error and drop statistics, thus making it a complete monitoring tool. The data often used is for capacity planning and optimization.


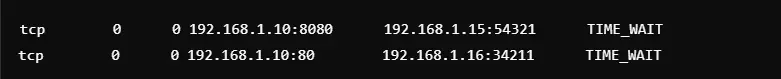
14. Find High-Latency Connections
Command: netstat | grep TIME_WAIT
This command identifies connections that are in the TIME_WAIT state. These are usually indicative of high-latency or recently closed connections. They can be used for troubleshooting performance issues or for examining the effects of long-lived connections. Administrators utilize them to fine-tune server settings and reduce delay. The output will provide local and foreign addresses involved with affected connections. These details are helpful in troubleshooting and solving network inefficiencies.
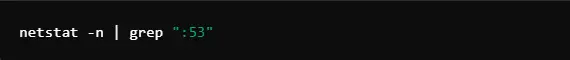
15. Debug DNS Resolution Issues
Command: netstat -n | grep “:53”
This command monitors the DNS traffic by checking if there are any connections in port 53. The administrator is then able to troubleshoot the DNS resolution problem to ensure proper resolution of the name in services. This is helpful, especially in the case of failed or very slow DNS queries. Output includes specific information regarding source and destination IPs engaged in DNS. It can help diagnose DNS server performance and configuration problems.

Most Useful Netstat Options
| Option | Description |
| -a | Show all active connections and listening ports. |
| -t | Filter TCP connections only. |
| -u | Display only UDP connections. |
| -l | List services listening for incoming connections. |
| -p | Display process IDs and program names. |
| -r | Show kernel routing tables. |
| -i | View detailed network interface statistics. |
| -s | Display detailed statistics for each protocol. |
| -e | Show extended information, including Ethernet statistics. |
| -n | It shows addresses and port numbers in numerical form. |
| -c | Refresh output continuously. |
| -v | Show verbose output. |
| -g | Display multicast group memberships. |
| -w | Display raw network data. |
| -M | Monitor network connections in real time. |
| -C | Display only established connections. |
| -x | Display Unix socket connections. |
| -d | Dump raw network state. |
| -f | Show fully qualified domain names instead of IP addresses. |
| -o | Display timer information for each connection. |
How CyberPanel Improves the Netstat Command Linux Experience
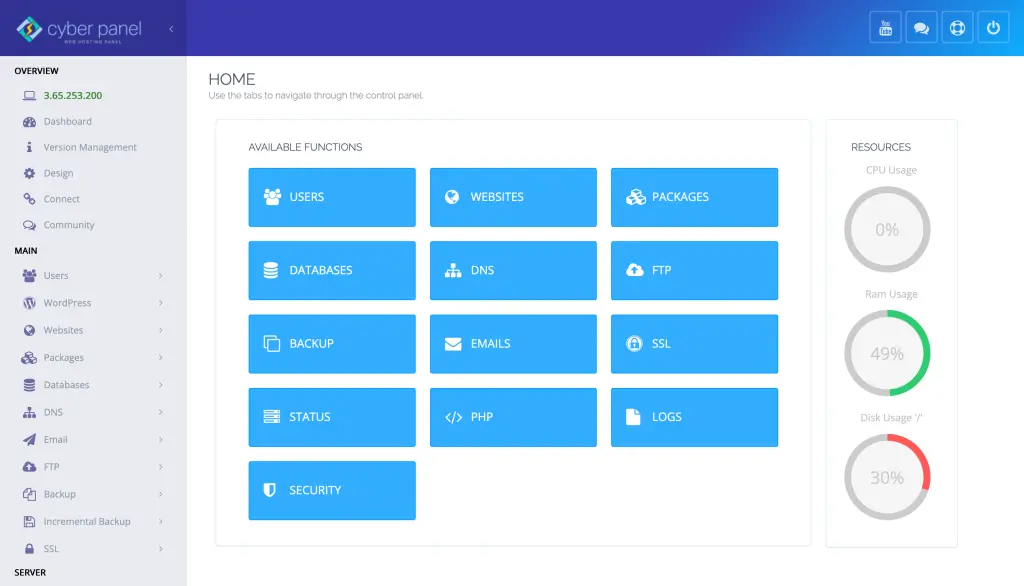
CyberPanel, being a web hosting control panel, simplifies all your activities concerning network managing and monitoring of server performances. Here is how it enhances your netstat command Linux experience:
1. Real-time Monitoring
Server traffic and performance can now be monitored real time because CyberPanel is provided in its graphical user interface which simplifies network diagnosing.
2. Log Management
Log viewer integration of CyberPanel helps complement netstat for cross-references on deeper network activities from the system logs.
3. Better security
Apply CyberPanel on your network so that it recognizes and handles suspicious activity and blocks those IPs along with closing unnecessary ports opened through netstat.
4. Auto-diagnosis
CyberPanel automates several things that you need to manually do in diagnostics, thereby saving time.
FAQs about the Netstat Command on Linux
1. What is netstat command in Linux?
Netstat command in Linux is an effective command for showing active network connections, open ports, routing tables, and interface statistics, and therefore, monitoring network activity.
2. How to show active connections using netstat?
By using the netstat command in Linux, you can list all the active connections and listening ports easily to monitor your system’s network activity.
3. What is the purpose of the netstat -t option?
With the Linux netstat command, the -t option allows you to filter results and see only TCP connections so you may focus your efforts on active connections using the TCP protocol.
4. How can I use netstat in Linux to see UDP connections?
Using the -u option with the Linux command netstat, you filter and print only the UDP connections so that you have insight into your system’s UDP traffic.
5. How do I check a routing table with netstat?
Using the netstat command in Linux with the -r option displays the kernel routing table for your system so that you can see which paths your network traffic is taking.
6. Does netstat allow showing process IDs for network connections?
Yes, with the netstat command in Linux, you can display process IDs and associated program names using the -p option, which will help you identify which processes are using network resources.
Final Take: Unleash the Potential of the Netstat Command for Advanced Linux Network Monitoring
Finally, the netstat command is one of the most important commands for monitoring network connections, open ports, and system performance in Linux. It makes you aware of your system’s network activity and provides proactive optimization of its performance.
CyberPanel lets you easily manage your Linux server with no hassle and with complete control. Optimize your network management today with CyberPanel and experience the ease of its integration!
